


Die Expedition MSM20/2 nach Tristan da Cunha ist Teil des Projekts ISOLDE und des DFG-Schwerpunktprogramms SAMPLE. Weitere Informationen finden Sie hier:
Der Tristan & Isolde Blog
Hier können Sie unserer Forschungsreise nach Tristan da Cunha und von dort weiter nach Recife (Brasilien) folgen. Wir bieten Ihnen Einblicke in unser wissenschaftliches Projekt, in die Freuden und Herausforderungen des Bordlebens und in unsere Erkenntnisse über die Geophysik des Südatlantiks.
15. Februar 2012: Suape, Brasilien
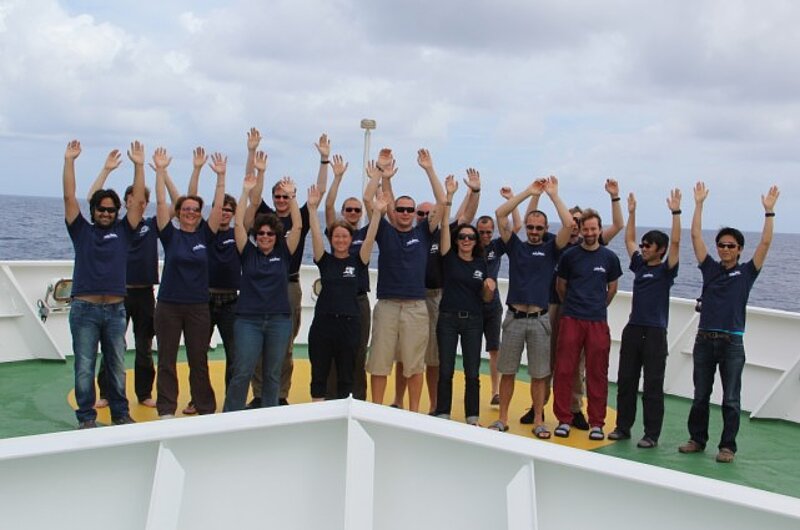
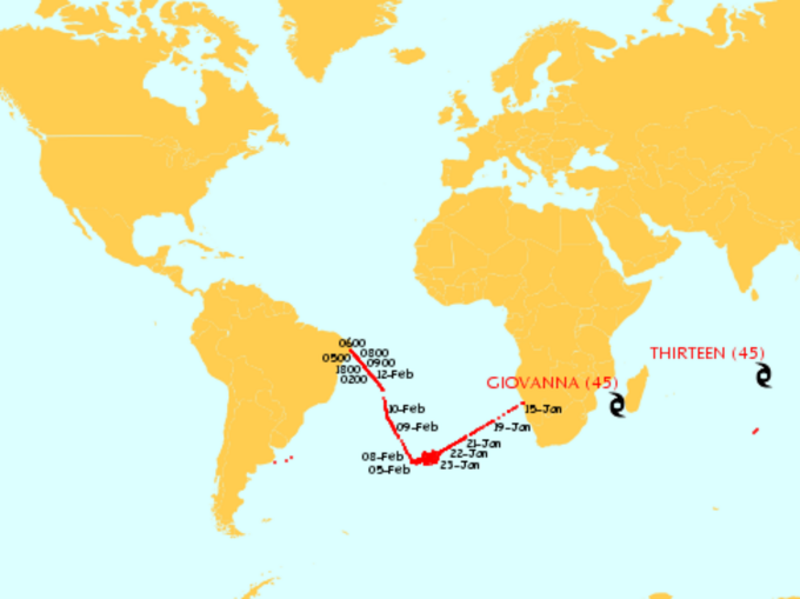
Unsere Überquerung des Südatlantiks ist vollendet. Nach 30 Tagen auf See erreichten wir heute Morgen den Hafen von Suape in Brasilien. Eine tropische Sonne brennt bei Temperaturen um 30 °C auf uns herab, aber es ist sehr feucht und fühlt sich eher wie 40 °C an. Das Abladen der Container läuft. Die Fahrt ist sehr gut verlaufen: Wir haben eine beeindruckende Region dier Erde erlebt, alle Experimente konnten wie erhofft ausgeführt werden. Die MERIAN hat sich als ideale Plattform für die Arbeit, aber auch für das Leben auf See bewährt und die Gemeinschaft an Bord war angenehm. Wir freuen uns darauf, die ausgelegten Instrumente in einem Jahr wieder zu bergen. In der Zwischenzeit hat jeder von uns einen erstklassigen Gesprächseinstieg: “Ich war auf Tristan da Cunha, der abgelegensten Insel der Welt.”
14. Februar 2012: Wiedereintritt in die reale Welt
Die Fahrt nähert sich ihrem Abschluss: Wir räumen die Labore und die Kabinen auf, sichern alle Daten und beenden die Berichte. Morgen werden wir den Hafen von Suape 50 Kilometer südlich von Recife erreichen, wo unsere Container von Bord und die der nächsten Expedition an Bord gebracht werden. Vor zwei Tagen haben wir am Horizont ein Schiff gesichtet - es war erst das zweite, seit wir die Küstengewässer Namibias verlassen haben. Heute haben wir noch eines gesehen. Gestern war das Schiff wieder in Reichweite eines Internet-Satelliten, und wir konnten uns durch eine Monatsflut an E-Mails wühlen. Eine Erfahrung außerhalb von Raum und Zeit geht zuende. Wir sind dabei, wieder in die reale Welt einzutreten - mit gemischten Gefühlen.
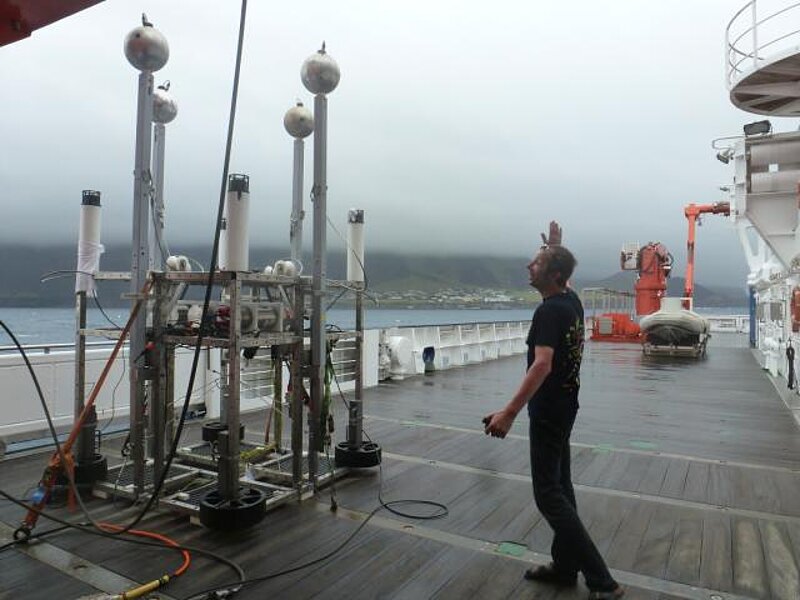
13. Februar 2012: Rückblick Nightingale Island II
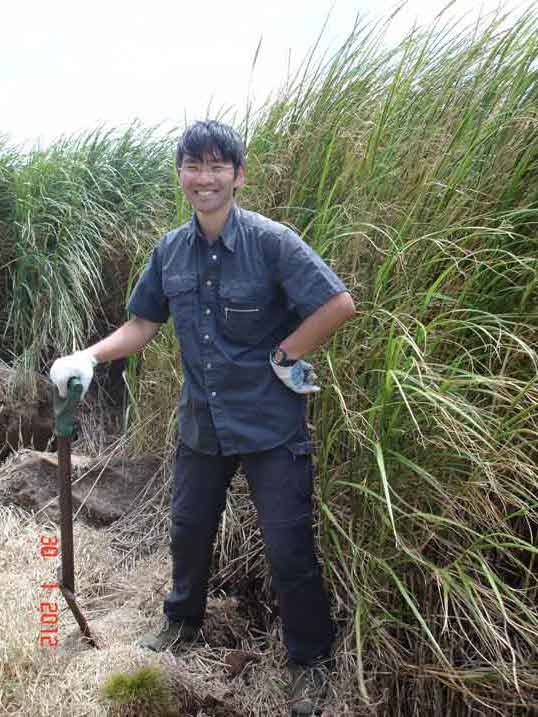
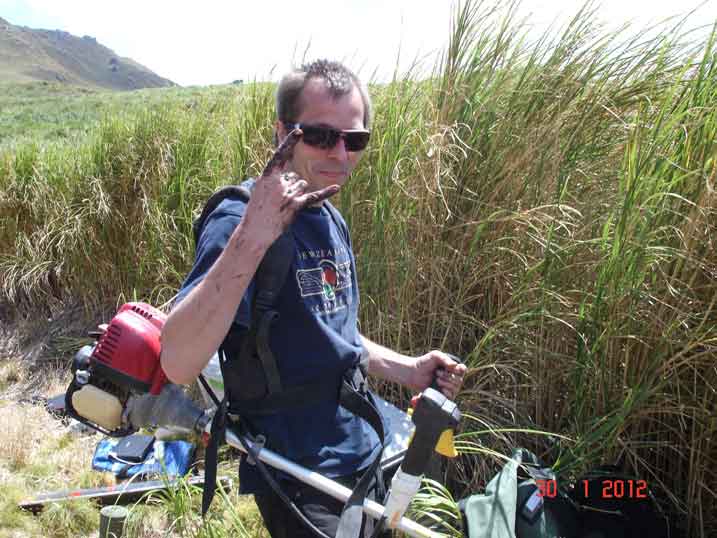
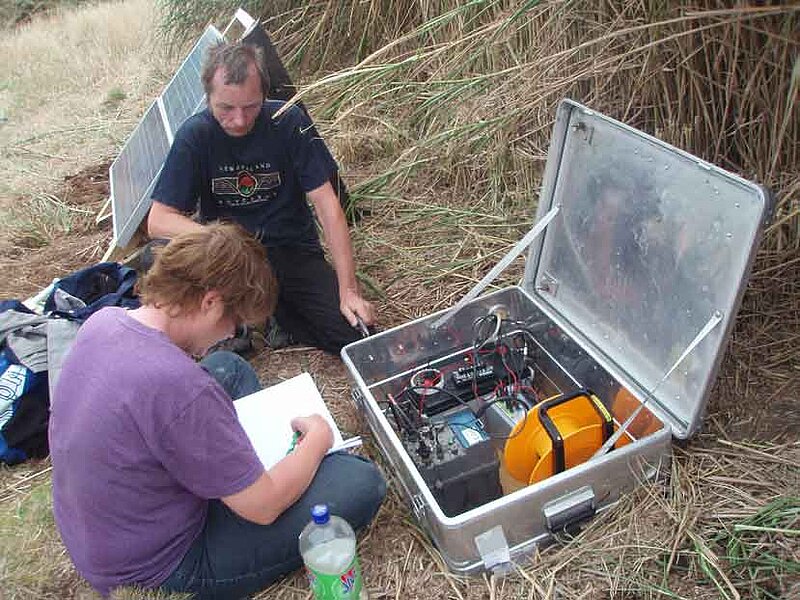
We had to dig holes to bury the instruments in the ground, program their data loggers, and set up the solar panels (images 1 -2). The land data are an important addition to our marine data, especially to the electromagnetics, since land data are not affected by the wave damping and sometimes noise-inducing effect of the ocean layer. They also allow to extract higher-resolution information about the earth.
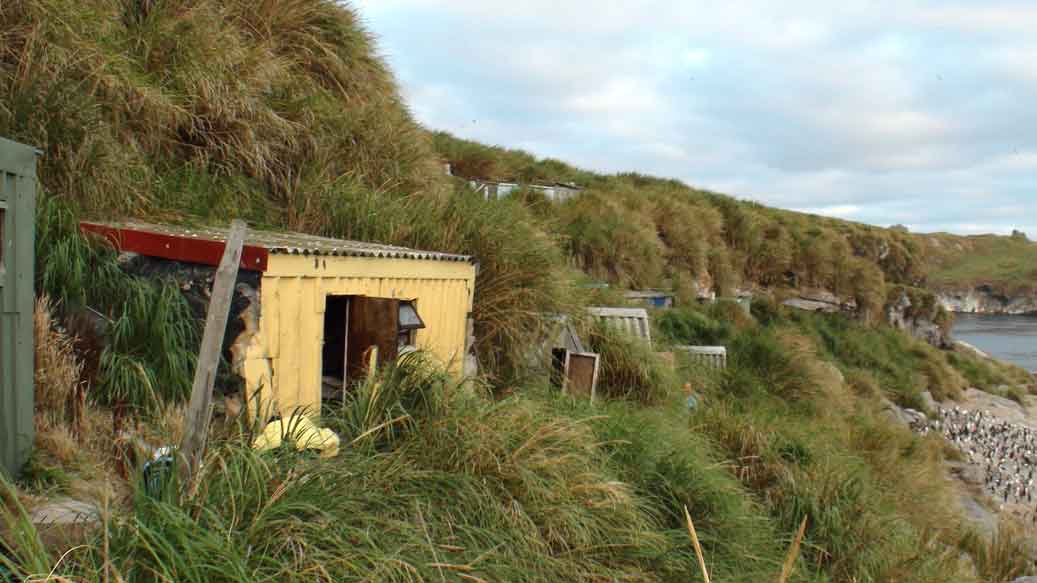
After most of the installation was accomplished, we retired to a row of little shacks, which have been built by the Tristanians for vacation and nature reserve work on the cliffs of Nightingale (images 3-4). The lodging and its amenities did not exactly amount to 5 stars, but the unhindered view of the ocean, hunting seals and birds, with Tristan da Cunha on the horizon definitely did.
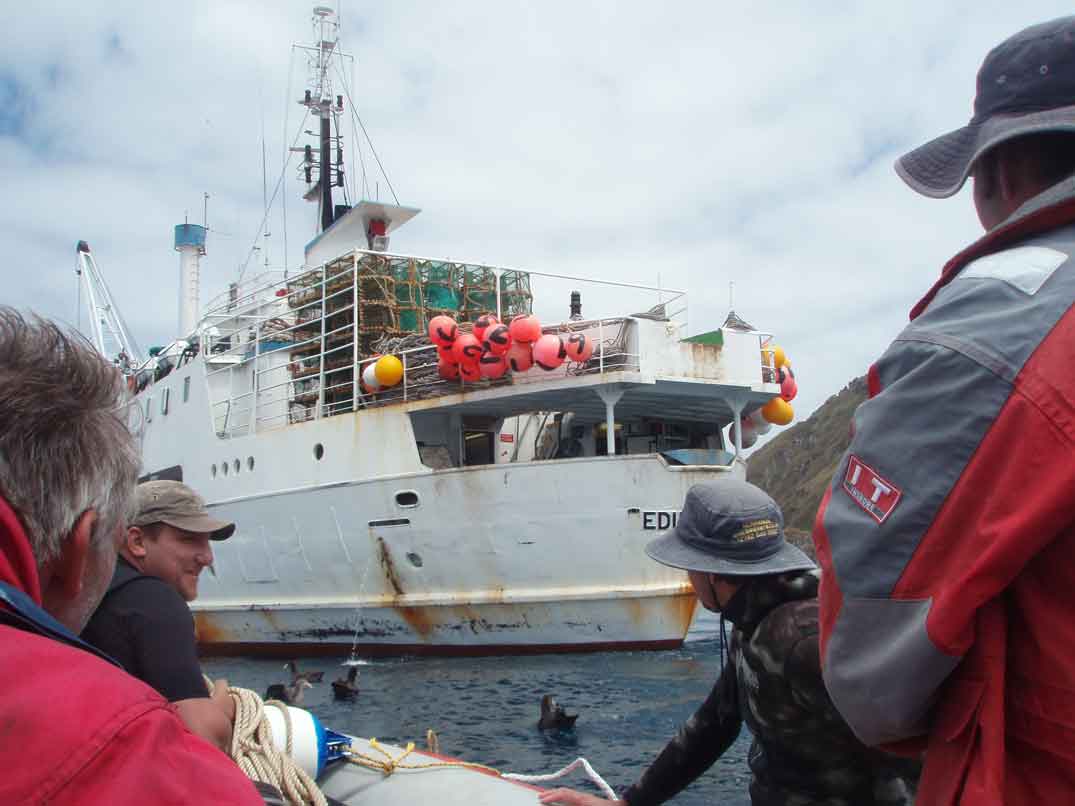
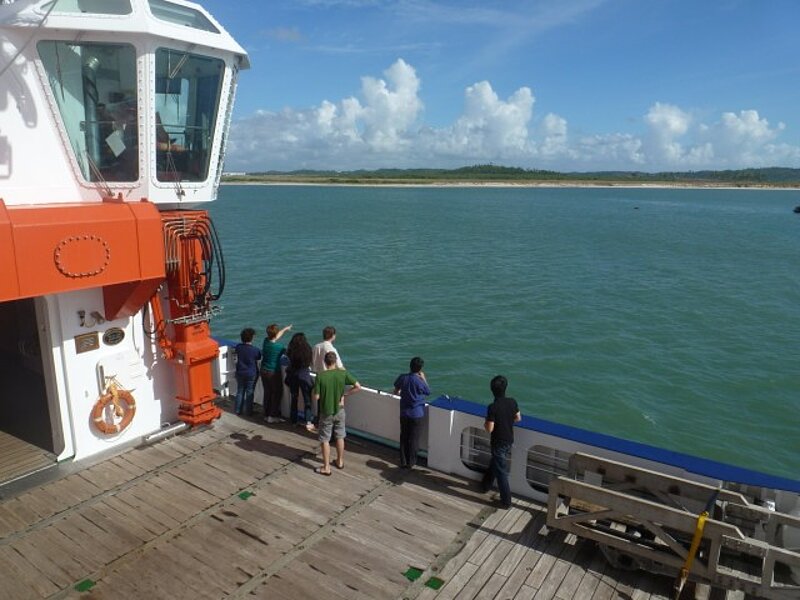
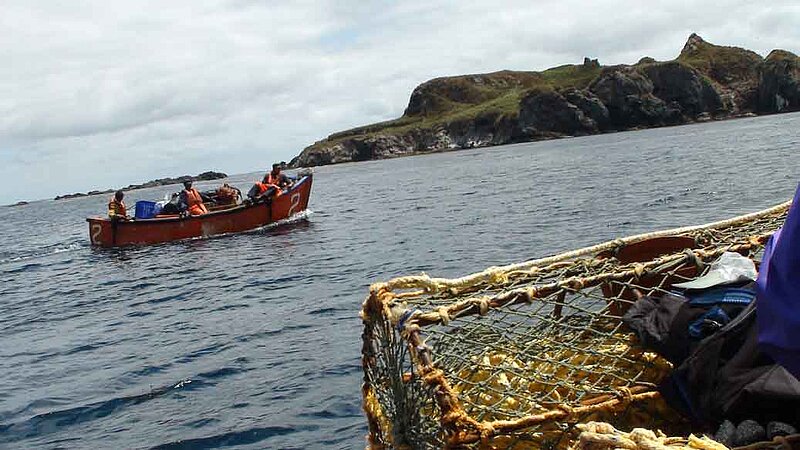
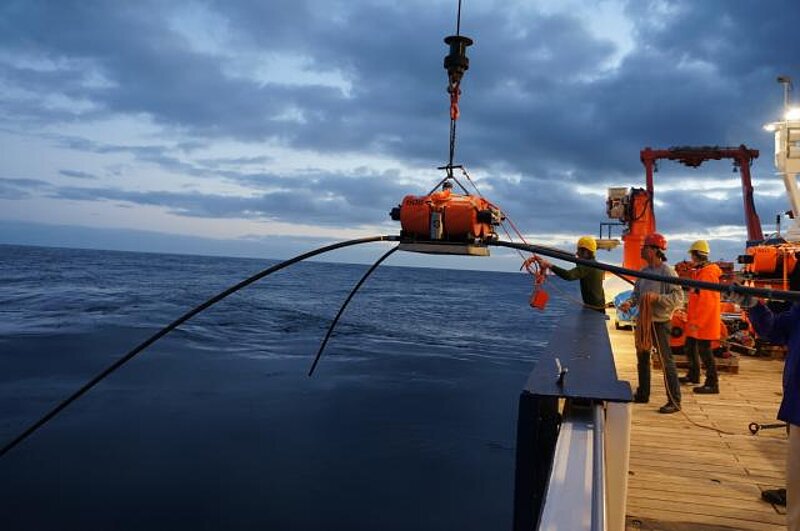
After checking the land stations in the morning, we radioed the nearby fishing vessel Edinburgh, whether they could give us a lift back to Tristan. They were kind enough to send three of their little boats that checked on lobster traps to ferry us to the ship (images 5-6).
Back on Tristan in the evening, a long hot shower and delicious food cooked by our Tristan hosts, prepared us well for a visit to the local bar, where Tristanians of all ages gather in the evening for a friendly chat, and a few sodas and beers.
Karin Siglich/Marion Jegen
12. Februar 2012: Rückblick Nightingale Island I
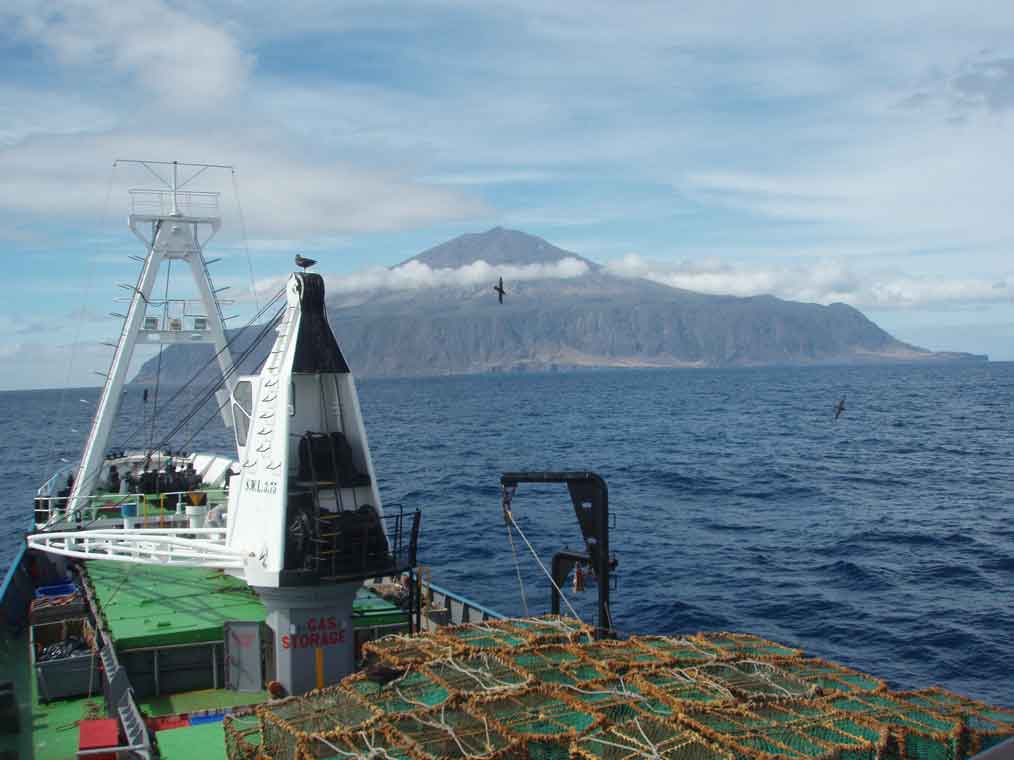
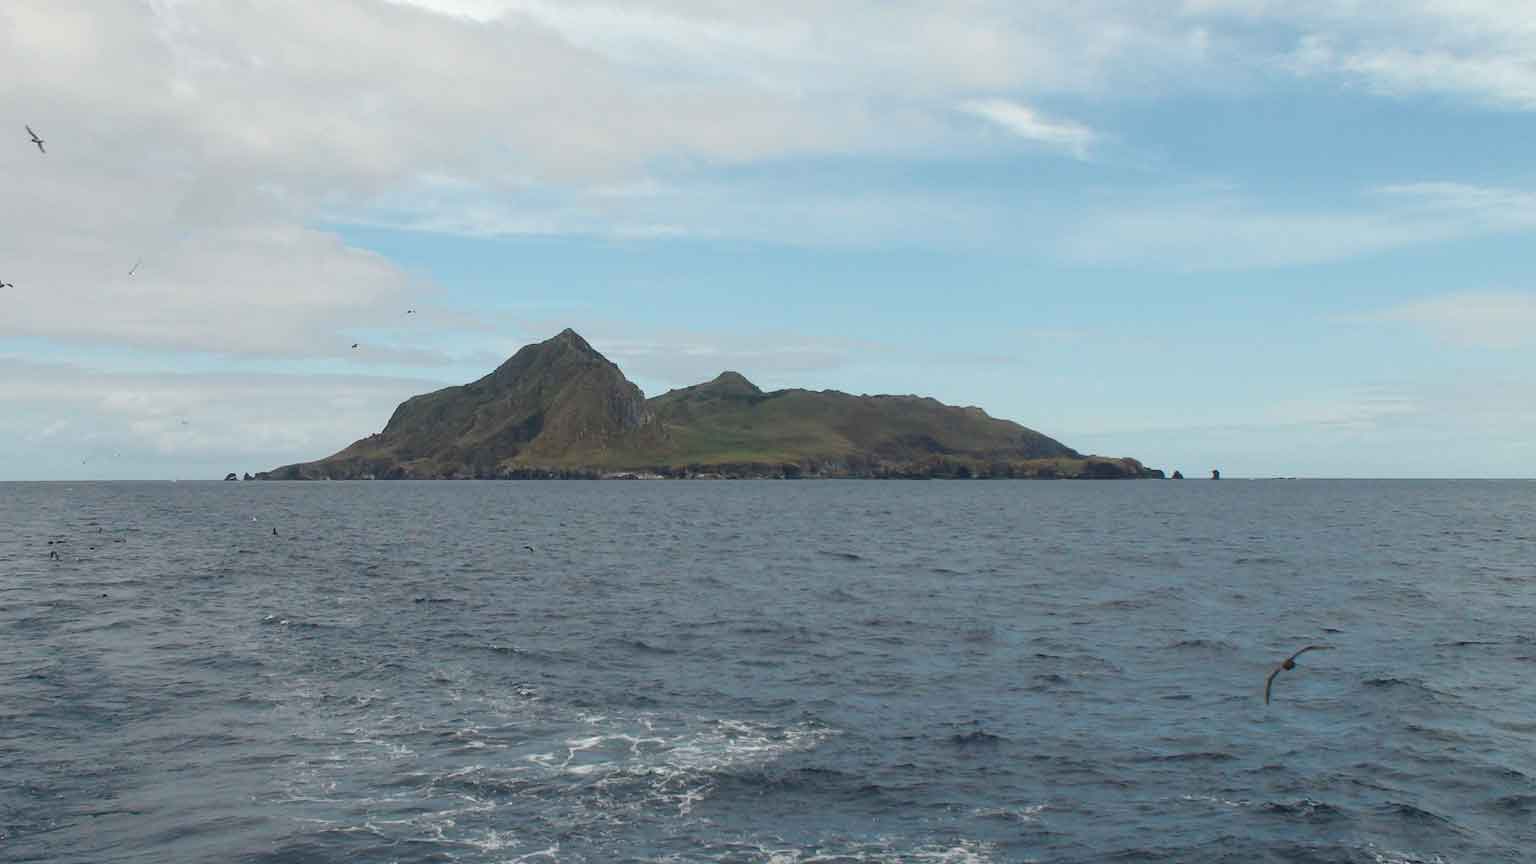
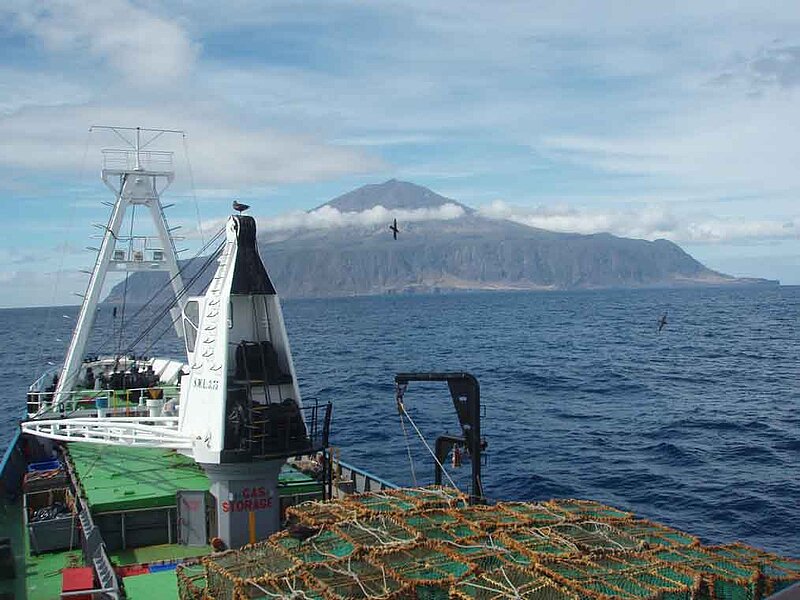
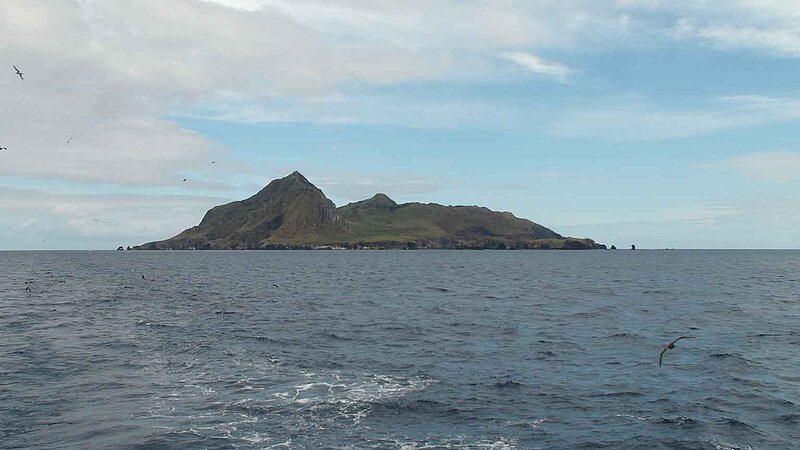
Now that the scientific activity has decreased, it is time to report on another highlight of the cruise, our little land expedition to Nightingale Island. Five scientists and technicians had debarked the MERIAN on Jan. 30 to install electromagnetic and seismic land stations on the uninhabited island of Nightingale, which is situated ~30 km south of Tristan da Cunha (image 1). Guided by three Tristanians, we boarded two little ships in the morning of Jan. 31 for the one-hour ride from Tristan to Nightingale. While a swell may look relatively small from a ship like the MARIA S. MERIAN, it feels a lot more exciting when experienced on a small rubber boat equipped with a 400-horse power engine. Luckily the fresh wind, sunshine, breath-taking scenery and sightings of flying fish prevented a return of seasickness.
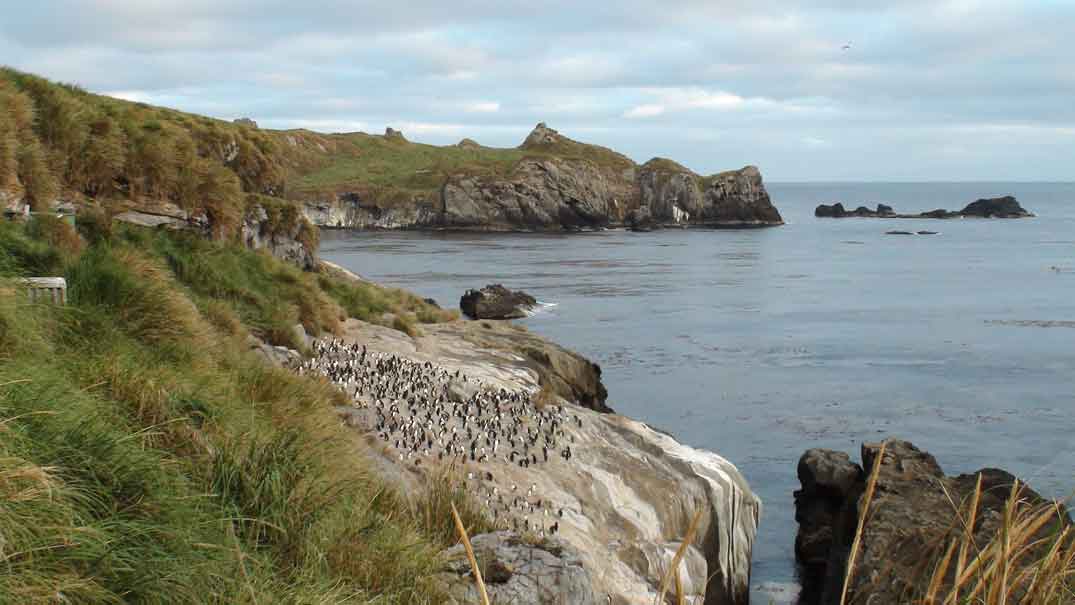
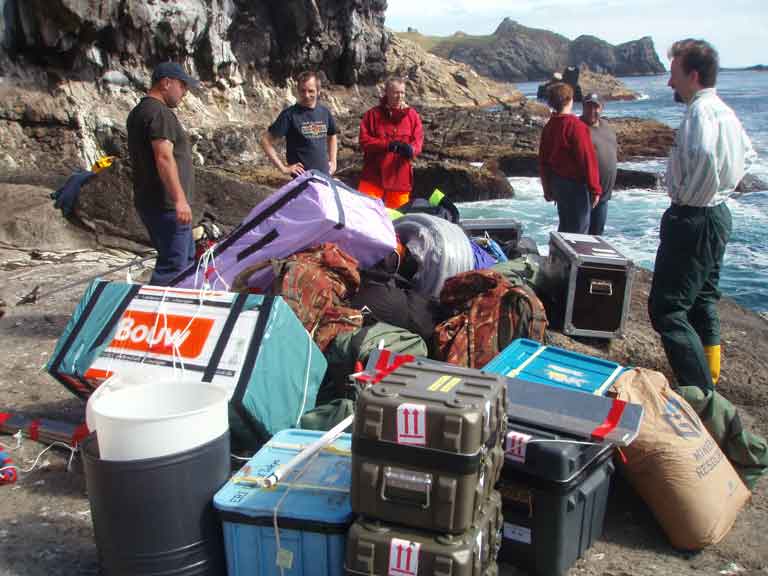
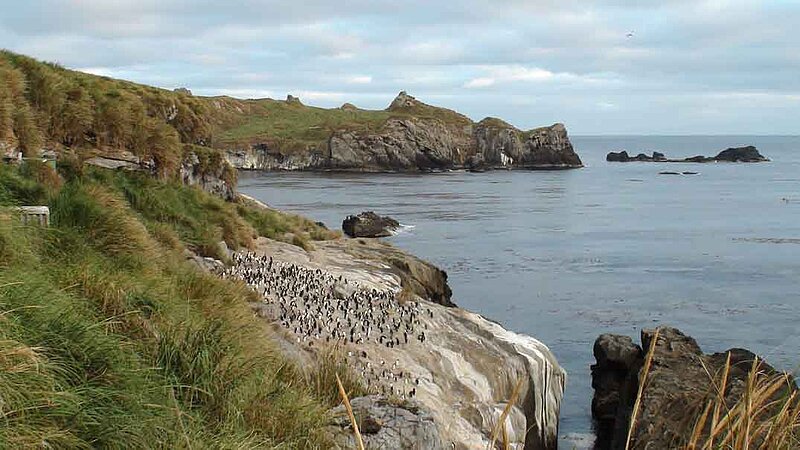
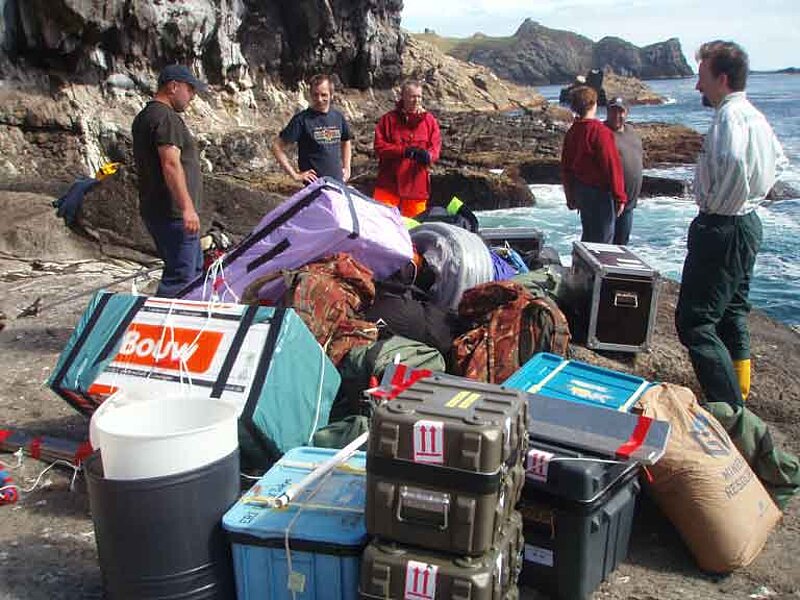
The landing point on Nightingale (image 2) was a bare rock inhabited by seals and rockhopper penguins. We had disassembled our land stations in waterproof packages that were as small as possible, ranging from a few to 20 kg weight, which were offloaded with speed and dexterity by the Tristanians.
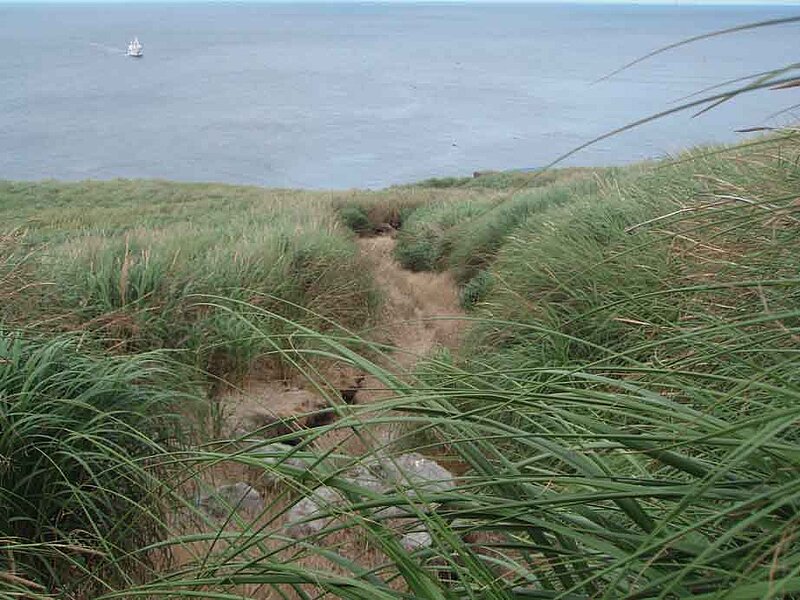
A good, level site for the land station was found ~300 m from the landing point, up along a rocky and steep path (image 3). Lugging the equipment up there was rather exhausting.
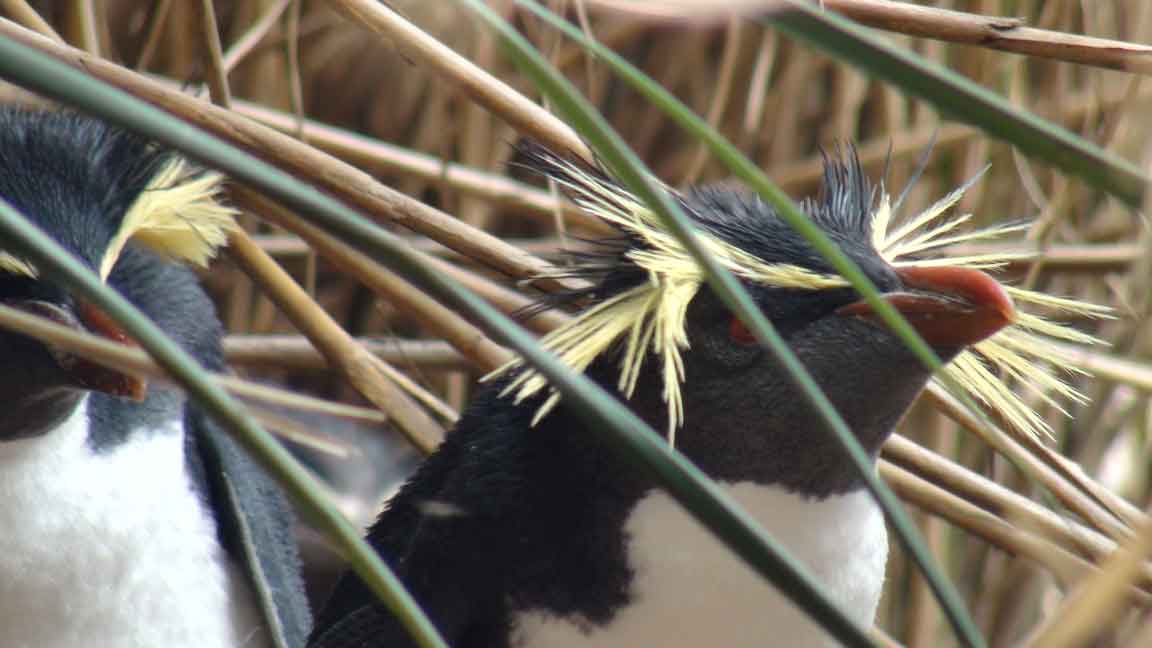
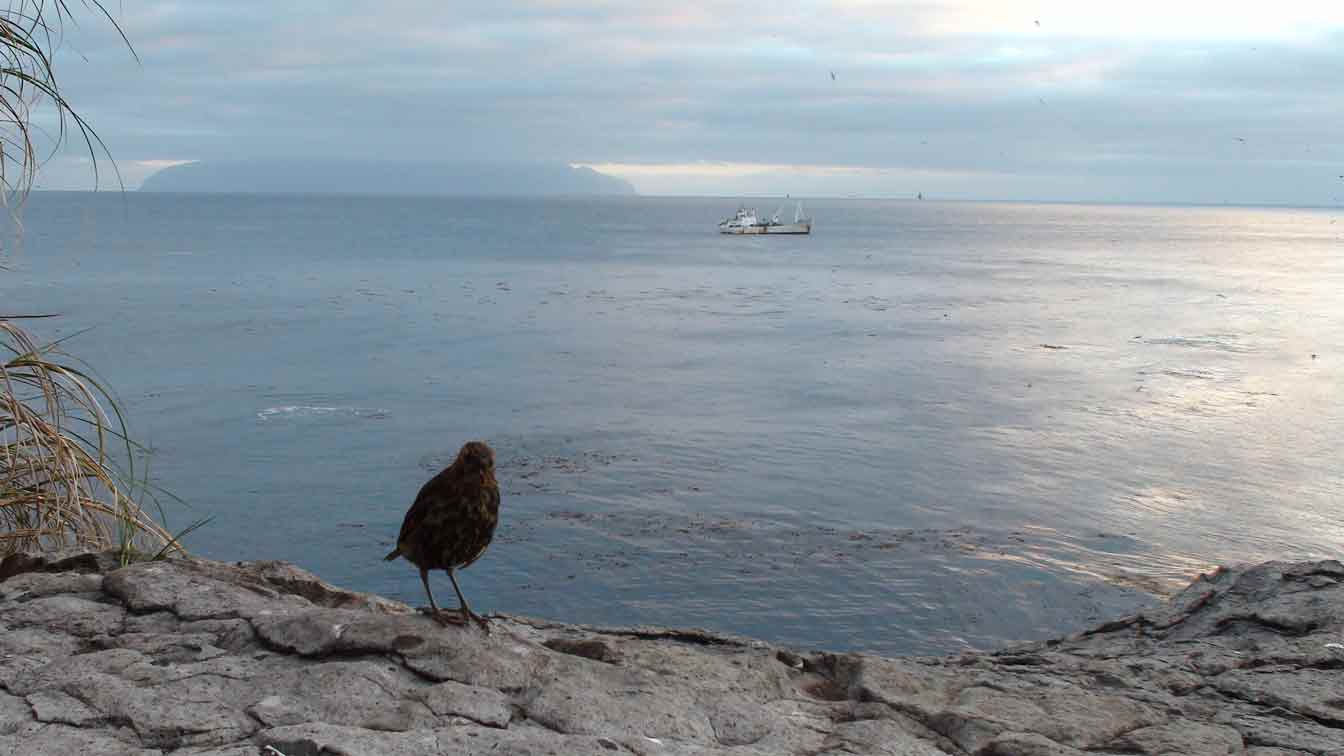
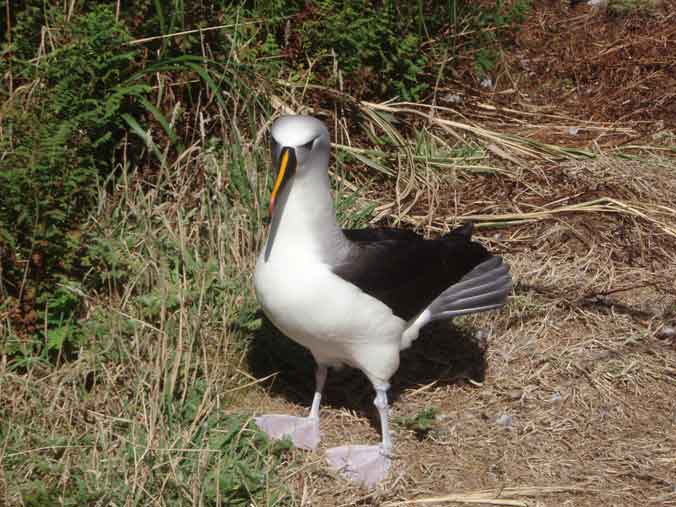
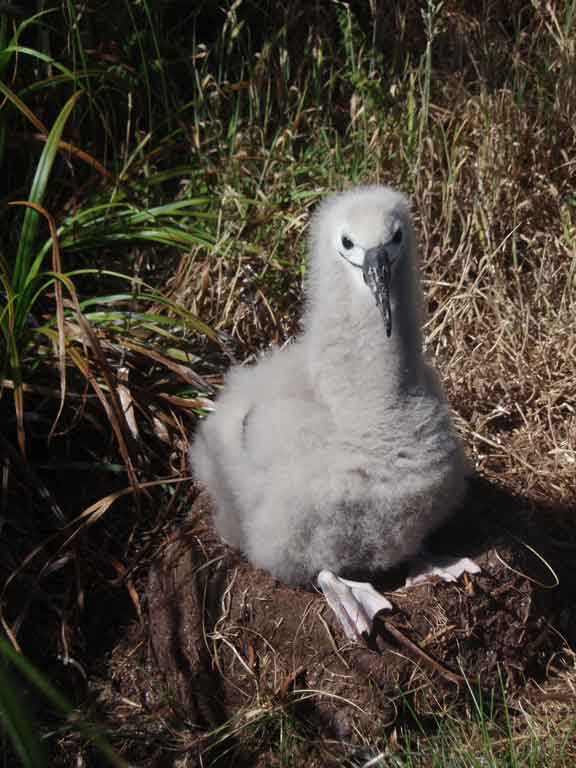
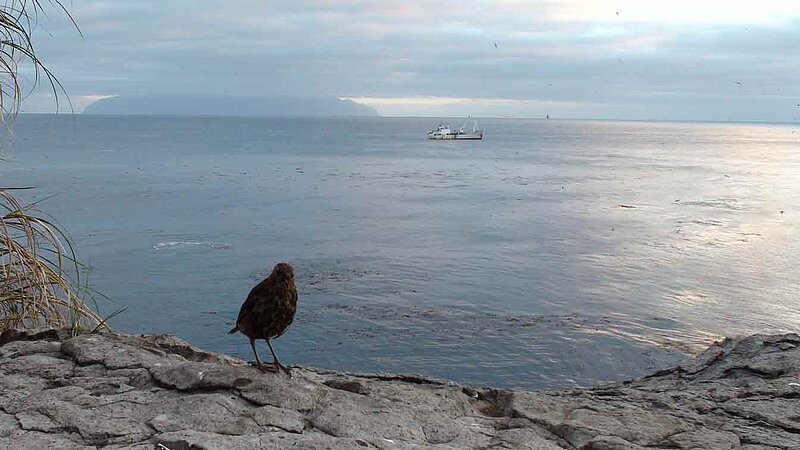
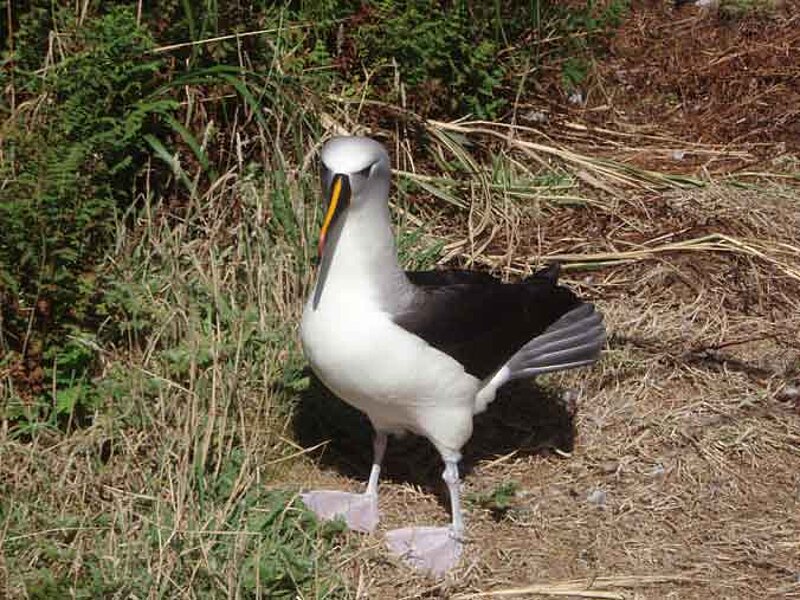
We were watched closely by penguins, very curious little Tristan thrushes, which had to be chased out of the equipment from time to time, and by albatrosses. At first the notion of an undisturbed sanctuary of what seemed like thousands of birds seemed rather romantic, but the reality of hundreds of dead birds in various stages of decomposition put a somewhat pungent smell to our work, and took a few hours to get used to (images 4-7)
Karin Sigloch/Marion Jegen
11. Februar 2012: Reaching the tropics
On transit to Brazil, it has been getting warmer rapidly. Last night, the MERIAN crossed the nominal boundary from the subtropics to the tropics (latitude 23° S). From Namibia up to Tristan (at latitude 37.5°S), the temperature had been 20°C plus/minus 2°C every day. A rather abrupt rise in temperature and humidity occurred already on the first few hundred kilometers of the way north -- we must have changed into a warmer ocean current then. Now it is above 25°C, and it is still ways to go until Recife at latitude 8° S, where we will land during carneval week.
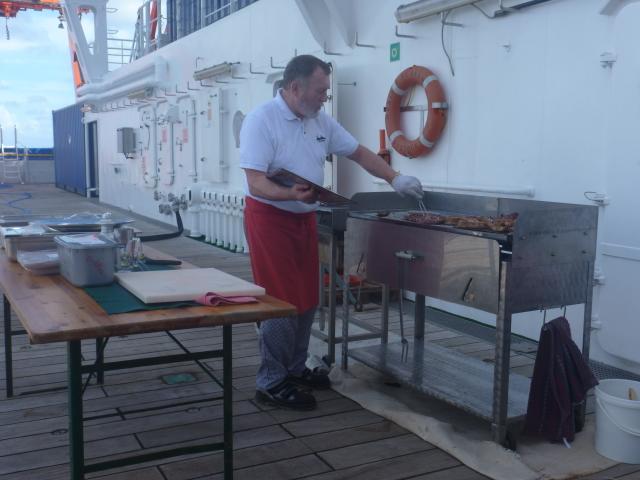
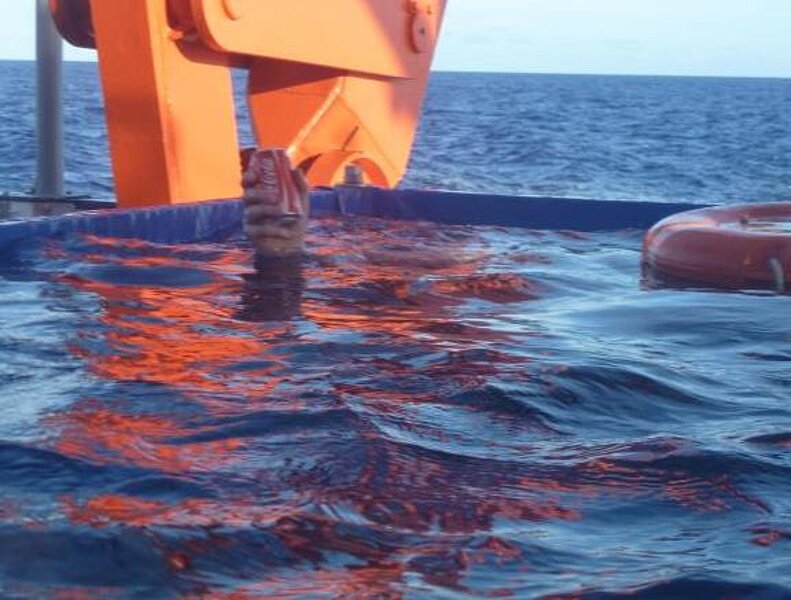
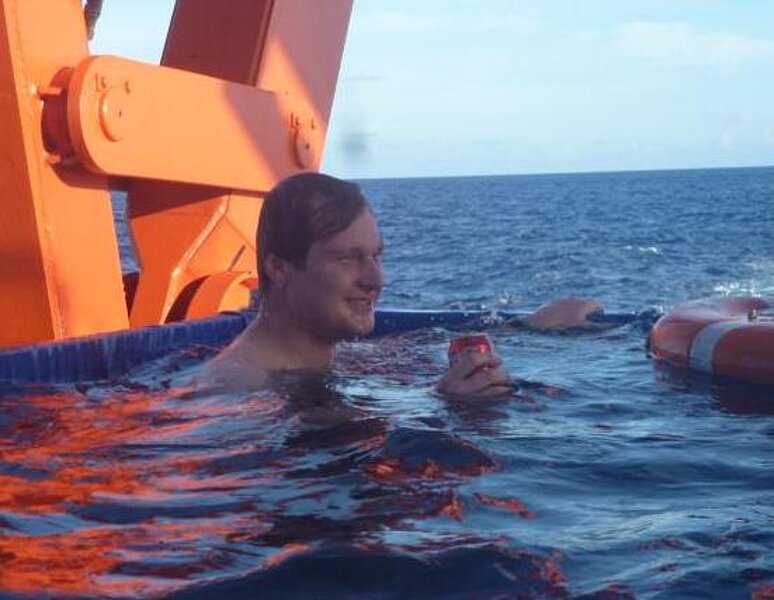
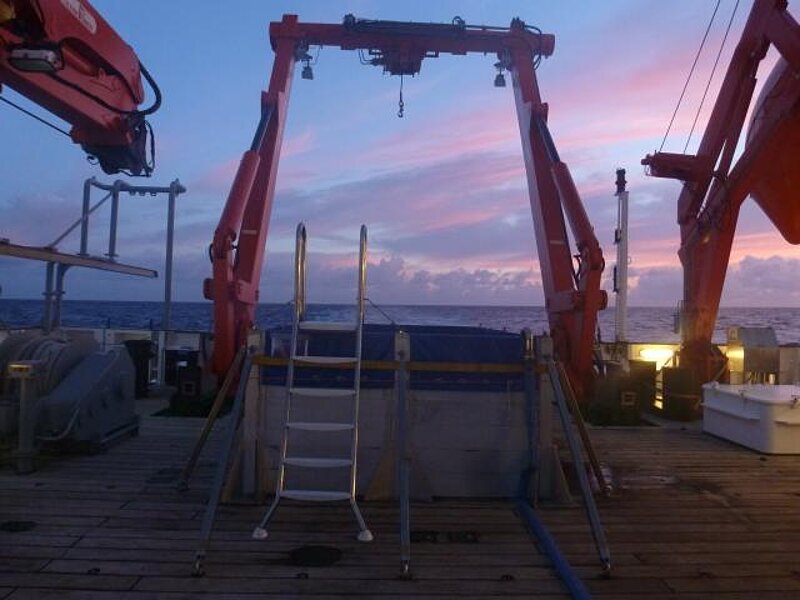
Summer in the southern hemisphere: Thursday's dinner took place on deck, as a barbeque. Chief cook Johann Ennenga and his assistants grilled the self-caught fish from Tristan, along with other delicacies. The ship crew have mounted an ultra-sturdy pool of about 3x3 m^2 on the rear deck, which is regularly refilled with fresh seawater that keeps getting warmer. A perfect way to end the day: in the heaving and rolling water, with a cold beverage, watching the sunset!
Karin Sigloch
10. Februar 2012: Geophysical methods II
How do seismic or electromagnetic waves give information about the structure of the earth's deep interior? The principle is this: we have some default assumption on what the mantle and crust under Tristan might look like -- some informed guess from earlier studies, or just the idea that it is “average” mantle. Some physical law must describe how seismic or electromagnetic waves would propagate through such mantle, assuming a wave source existed (an earthquake or the solar wind). Then computers can simulate this wave propagation, generating a prediction of what the wavefield would look like if we recorded it on the seafloor or on an island.
We do have actual instruments on the seafloor, but they will always record wave signals that are different from those predicted by the computer. This is because the structure of the real mantle and crust differs from that assumed in our simulation (if it weren't so, we would already know everything, no need to do the experiment). So the differences between the observed and predicted wave recordings somehow reflect the mantle structure that is still missing from our picture, but these waveform differences are not equal to the thing we want. They are just some indirect expression of what we want (say, rock composition in the mantle), and the link is the physical law by which rock composition affects the shape of seismic waves, for example.
Such indirect inference problems (“inverse problems”) are much more difficult to treat than direct measurements. Usually there is not enough data to determine everything we want to know. For example, we had better deployed 1000 OBS and OBEM instead of 25, but this is not feasible. Instruments inside the mantle would be more useful than at the surface -- impossible. It would be better to have a physical law that relates temperature (a very interesting quantity) directly to electromagnetic signal strength. But there is only a law that invokes mantle conductivity (not so interesting), and temperature only indirectly, along with other quantities.
So these kinds of experiments involve imperfections, trade-offs, and usually a lot of computer simulations. The challenge is to squeeze as much information as possible out of the data, while also clearly identifying the aspects that we cannot know. “Inverse methods” are frustrating if you have a low tolerance for uncertainty, but they are the most advanced tools that geophysics has to offer for exploring the deep interior.
Karin Sigloch
09. Februar 2012: Geophysical methods I
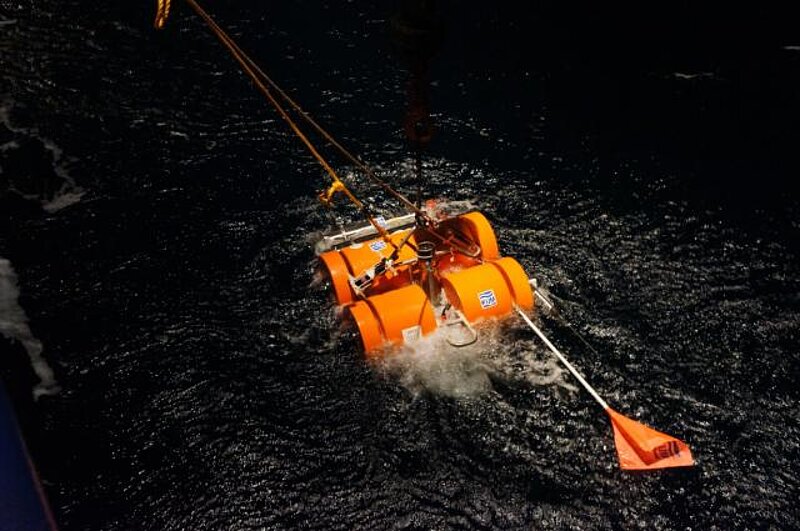
It is relatively simple to explain how bathymetric sounding of the seafloor works, because it is (almost) a direct measurement. We want to know the water depth, the apparatus counts the time it takes for the acoustic pings to run down to the seabed and back, and the only intervening variable is the sound velocity of water, which is relatively easy to measure. (Every other day, we lower a sounding probe into the ocean.)
Our other two geophysical methods are less intuitive, because they make indirect measurements. The problem is that geophysics has no methods to directly measure the quantities in the earth's deep interior that are of primary interest. Questions like: “How hot is it at 1000 km depth beneath Tristan?”, “What is the rock composed of at that depth?”, “Is a column of hot rock moving up towards the surface?” -- such questions cannot be answered by direct measurement. They probably never will, since humans are unlikely to ever penetrate to 1000 km depth.
Instead, we have to rely on indirect messengers, waves that travel through the deep earth. In the ISOLDE project, we are using two kinds: seismic waves (i.e. mechanical waves that propagate through solid bodies and fluids), and electromagnetic waves. Either wave type has a natural source, since humans do not generate waves of sufficient strength. The seismic waves are generated by small and large earthquakes. Those need not occur close to Tristan, on the contrary: often the earthquakes that occur thousands of kilometers away are the most useful signal sources for us. They cannot be felt at theoe distances, but a large earthquake is registered by seismometers anywhere on earth. The electromagnetic waves are generated by the sun, which always emits jets of charged particles, the so-called solar wind. The fluctuating solar wind impinges on the earth's own magnetic field, thus causing it to fluctuate. The constant changes in magnetic field are felt on the ocean floor as well -- they are the source signal for the electromagnetic sounding of the mantle.
Karin Sigloch
08 Februar 2012 - Bye Bye, Tristan!
We are in transit to Brazil now. Yesterday afternoon, the last dedicated bathymetry was collected, and Sputnik took another dive. Then the ship accelerated to 13 knots, taking course for Recife. We should arrive there on Feb. 15, to hand over the ship to the next group of scientists.
The daily routine is quieter now, and while we are still acquiring routine bathymetry during transit (to help improve geodetic satellite maps), this only requires infrequent night shifts of the scientists. People are catching up on sleep, or staying up longer at night. We process the bathymetry data, finish up deployment protocols and cruise reports. We also resumed our pre-deployment habit of giving short science presentations every evening. Since we come from different fields and institutions, we don't routinely work together. Now is an excellent opportunity for some focused exchange of ideas on Tristan, mantle plumes, break-up of continents, and the methods to study them. Our blog is likely to be less action-driven from here on, and instead mirror these reflections about the why's and wherefore's.
Karin Sigloch
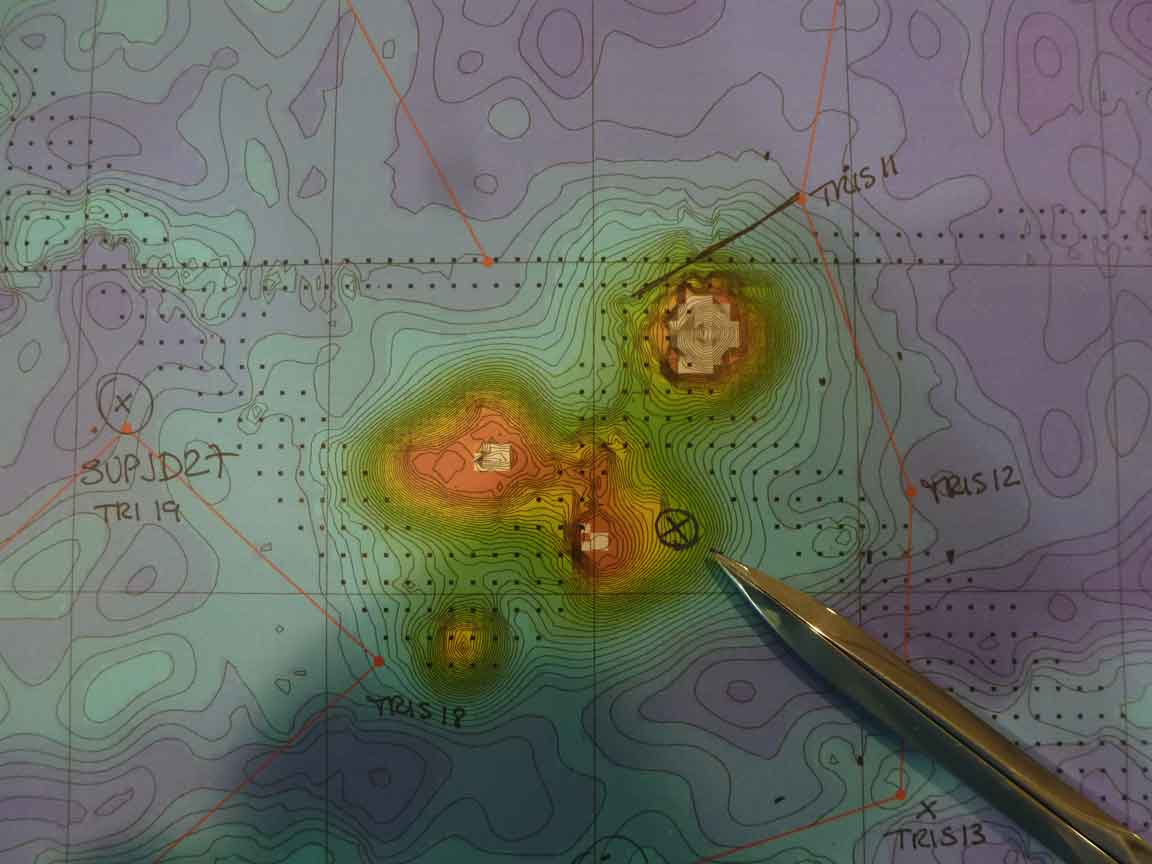
6. Februar 2012: Discovering a new undersea volcano
The most exciting discovery of our bathymetry survey so far has been a new undersea volcano. Last Tuesday night, during our colleagues’ field trip to Nightingale, the MERIAN was cruising around the island group for some initial seafloor soundings. The colleagues on bathymetry watch noticed that water depth at the outer edge of one multi-beam did not taper down as predicted by the satellite map. So we returned two days later to map the whole area, and discovered a sizeable undersea volcano just east of Nightingale Island. It rises from ~1500 m depth to almost 250 meters below the surface.
Independently, the Tristanians had told our Nightingale colleagues that in 2004, there had been worries that the volcano on Tristan might erupt again. In the Settlement, they had started feeling tremors, seemingly originating from the south, the direction of Tristan’s big volcano. Some days later, fresh pumice (volcanic rock lighter than water) came ashore on the eastern beaches, near Sandy Point. The British Geological Survey was called in to investigate. They concluded that Tristan itself showed no signs of volcanic unrest, but that there must have been an underwater eruption, most likely towards the south, the direction of Nightingale.
So it is very likely that we have discovered the source of this 2004 eruption, since our newly mapped seamount lies ~30 km south of Tristan, and 10 km east of Nightingale. Now the new volcano needs a name -- we are leaning towards “Isolde”.
Karin Sigloch
5. Februar 2012: Bathymetry I
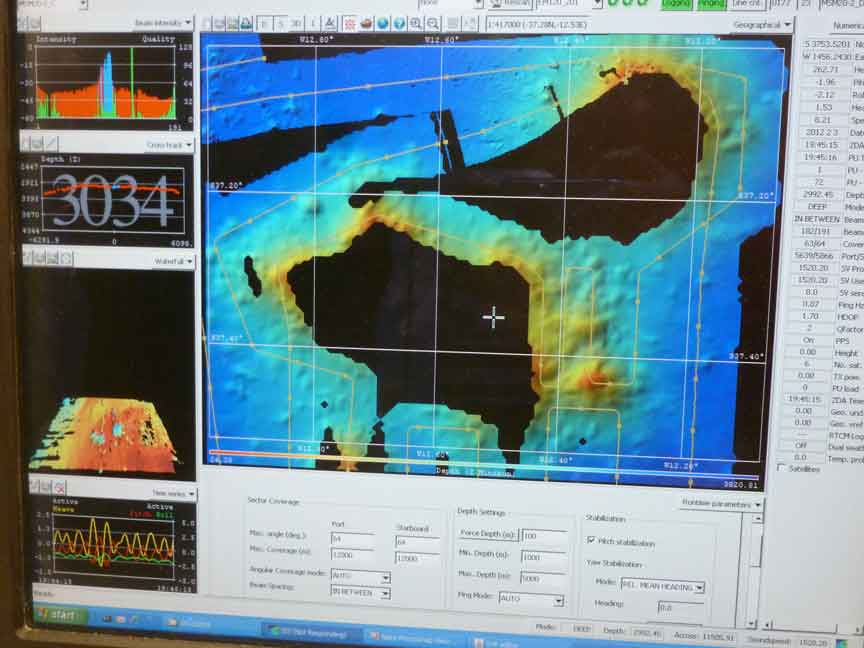
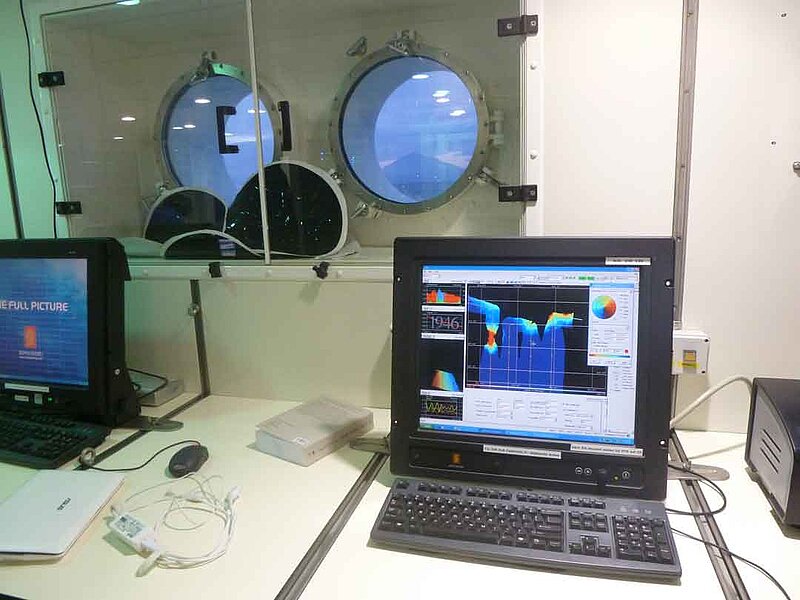
We switched to a different working mode, once the seafloor deployments and the field work on the islands had finished. The ship has slowed to 8 knots, and now we are mapping the mountains and valleys of the seafloor with a tool called multi-beam bathymetry. Acoustic sources are fixed to the outside of the ship's hull, and every ten seconds they send out short sound pulses at 12 kHz frequency. Then they measure the time it takes for the echos to return. This wait time is related to the distance to the seafloor and back -- if the velocity of sound at all water depths is known, the time can be converted into a water depth. (We measure the water velocity profile every day or two, by lowering a sounding instrument to 1000 m depth – see third photo.) The sounding method is called multi-beam because the MERIAN actually sends out and receives back 196 pings at once, at different angles. They simultaneously map a whole swath of seafloor that is a few kilometers wide to either side of the ship.
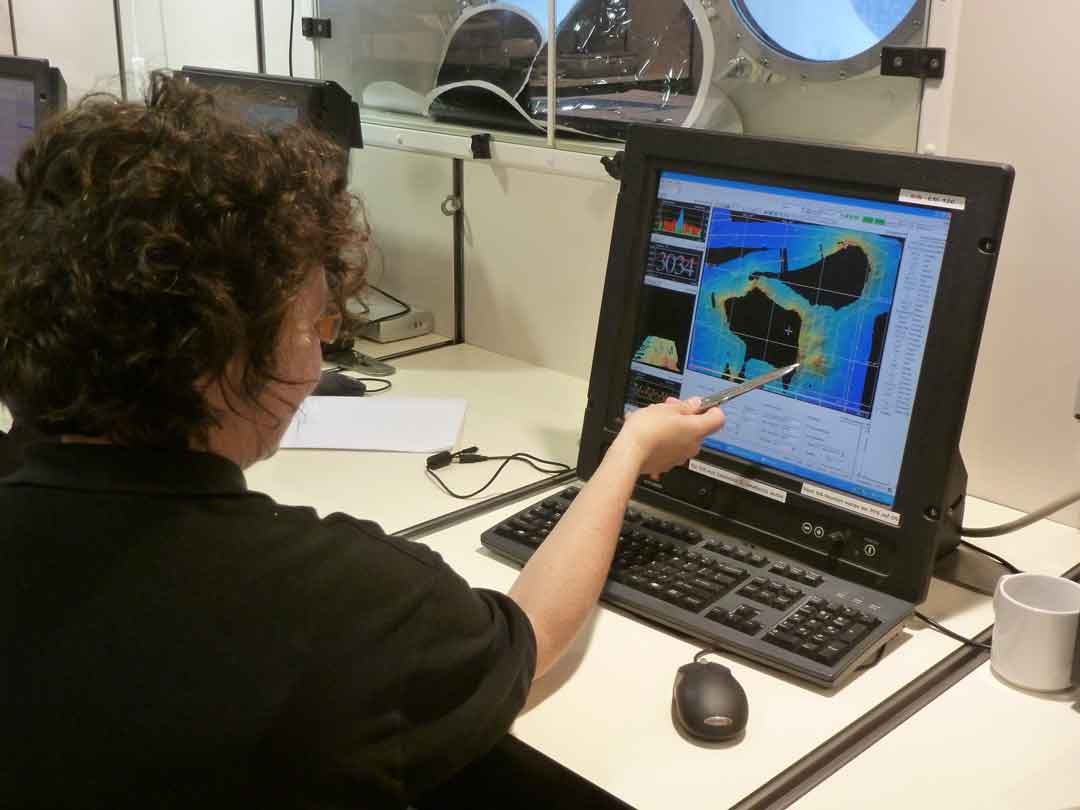
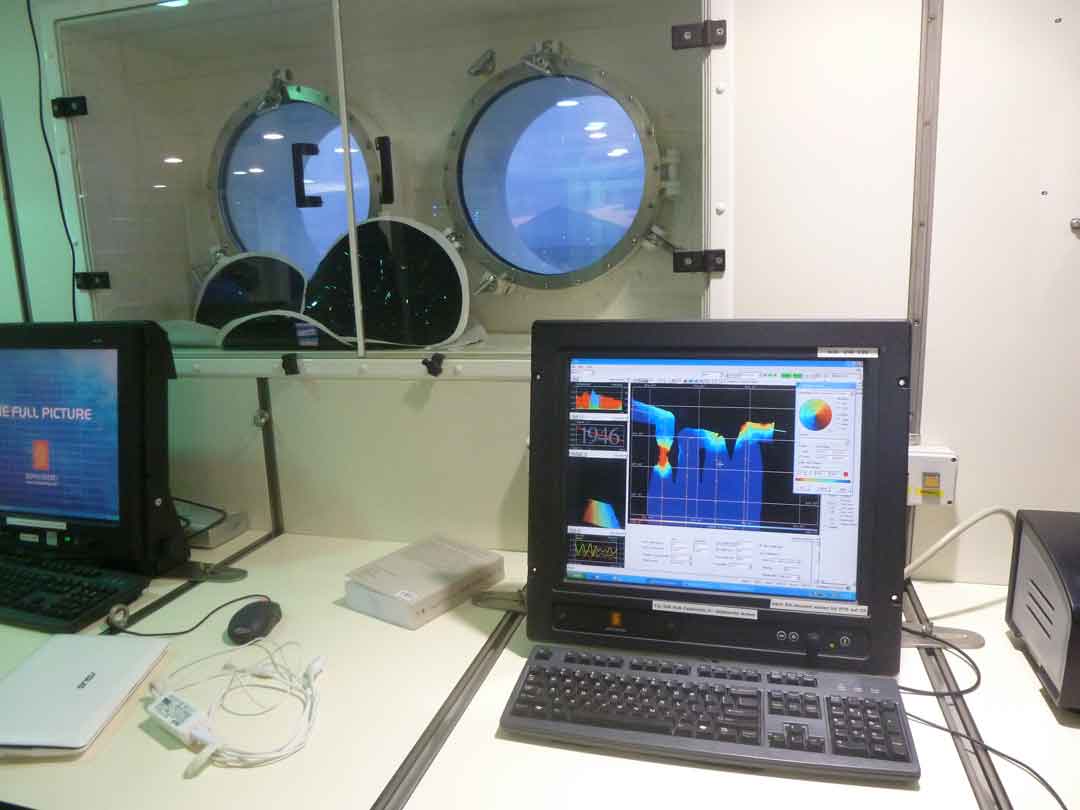
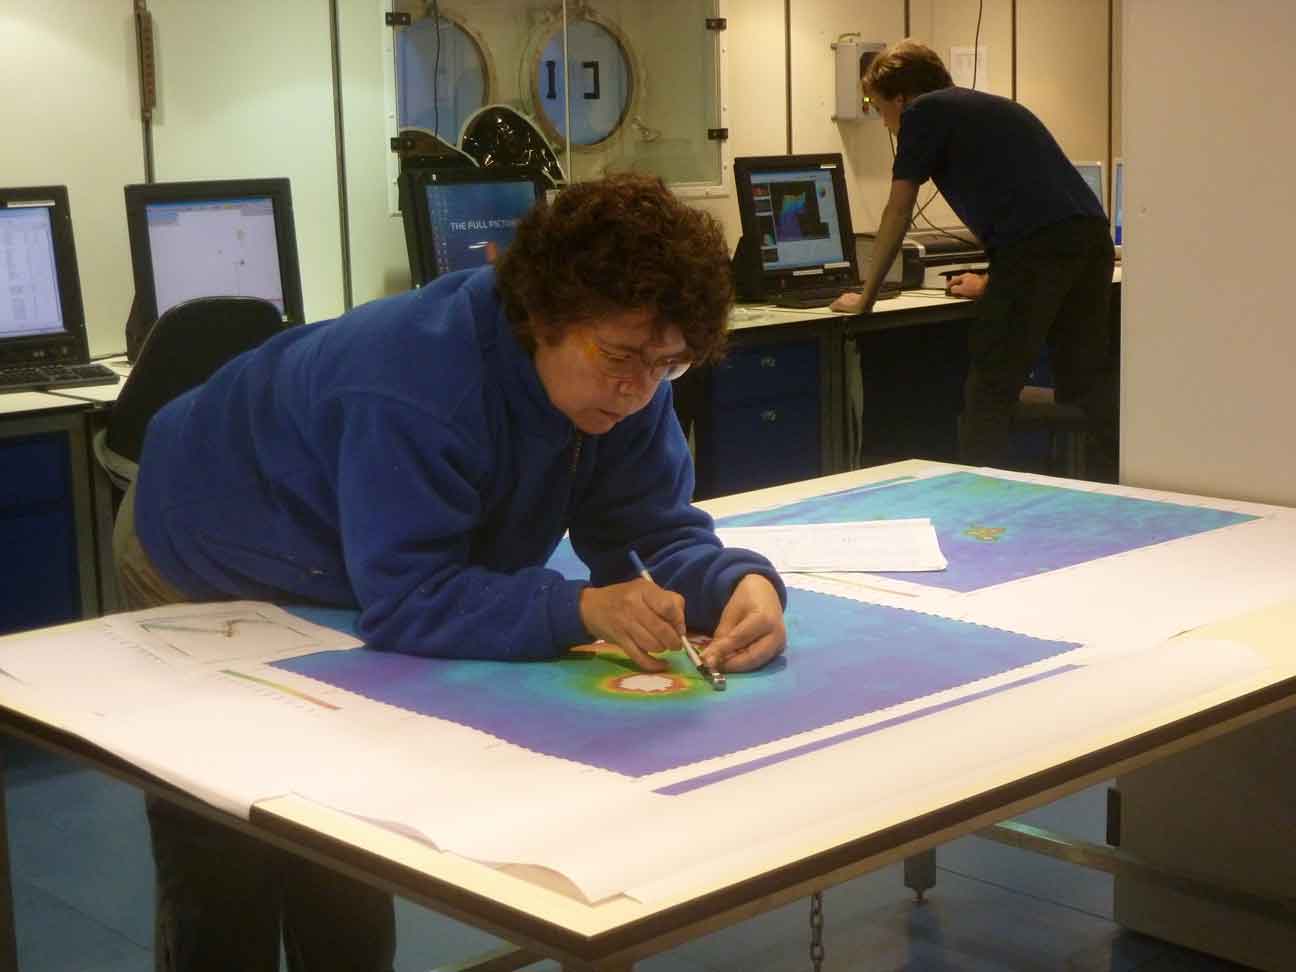
The results are displayed almost immediately to a computer screen (very gratifying, compared to the year-long wait times for OBS and OBEM data). Every ten seconds, a new colored line appears, corresponding to seafloor elevations just below the ship, and out to ~8 km to its left and right. Even a non-specialist can immediately pick out special features, for example the cone-shaped elevation above the average seafloor when we cross an undersea volcano, or the narrow, linear depressions that signify a tectonic transform fault. Marcia Maia from the University of Brest is the bathymetry specialist on board. She is charting the MERIAN’s course for the moment, in carefully designed zig-zag lines aimed at covering as many promising features as possible.
Only a tiny fraction of the world’s oceans has been mapped in this state-of-the-art manner, and our survey region is no exception. Marcia does not have to fly blindly in choosing the course, because predictions of seafloor elevation, although blurry ones, can be calculated using geodesy satellite data. There is still a lot of guesswork involved, what these blobs on the map might actually mean, and whether they are worth checking out. That is where Marcia’s expertise and intuition enter the picture. Those of us interested were invited to participate in the discussions and decision making, so people feel the corresponding emotional involvement, now that some exciting features have been discovered (see next blog).
Karin Sigloch