BELUGA Communication and Positioning Platform
BELUGA is a system for displaying and monitoring platforms and their measurement data during operations at sea in real time. Data received from the platforms is displayed with positions via a user interface (BELUGA Navigator). Data can be displayed directly on board and also made available in an interface that can be viewed online in near real time. In addition to the visualization of data, BELUGA can be used to communicate with platforms above and below the water.
The functionalities of BELUGA are explained in more detail in the section features.

Features of BELUGA
The functionalities of BELUGA can be divided into the areas of "monitoring and control of platforms", "data visualization" and "outreach".
Monitoring and Control of Platforms
- Communication with platforms above and under water
By receiving and displaying status information or measured values, operations can be tracked and, if necessary, events can be reacted to (for example, by sending an emerge command). - Automatic selection of the communication channel
When a message (for example, a command) is to be sent to a platform, BELUGA decides which medium (e.g., acoustic or WiFi) will be used to send the message. - Display of platform positions on the map (situational awareness)
The global positions of the integrated platforms are displayed in the map, which provides an overview in multi platform deployments. A measurement function in the map additionally allows to determine the distances between the platforms. - Customized dashboards per platform type
Individual dashboards offer different options depending on the platform. This allows the display of specific information as well as a selection of actions adapted to the platform. - Positioning
Using an Evologics USBL, the positions of integrated platforms can be determined from the base and sent to the platform (see Positioning).
Data Visualisation
- Real-time overview of received data on board
By displaying the platforms on the map and the transmitted measured values, an overview of the recorded data in the respective area is created. - Display of data in charts
In addition to displaying the last transmitted data of a platform, each parameter can be displayed as a chart over time. Additionally, the track of the platform is colored in the map according to the legend of the parameter. - Integration of external data into the map
Data can be integrated into the map as selectable overlays. In this way, for example, data created by models or recorded by satellites can be integrated into BELUGA. Examples are bathymetry or wind data. - Daten-Export
For fully integrated platforms, the downloading and processing of data can also be automated via BELUGA. In this procedure, the data is processed for storage according to standards and formats agreed with the data management. Part of the process is also to automatically generate a report of the exported mission if the necessary information has been maintained in the system.
Outreach
In addition to the system used on board during mission, there is a public version of the BELUGA Navigator that can be viewed online.
This can be accessed at: https://beluga.geomar.de
- Display of campaigns
Campaigns can be maintained for the onlie version only or, if running in BELUGA on board system, optionally be unlocked for the online version, too. Thus, campaigns can be followed online by scientists as well as other interested parties. The display is the same as in the ship system, except that online interaction with the platforms is not possible. - Medien-Feed
In addition to the display of platforms and their data, a feed can be displayed in the online version of BELUGA, in which, for example, reports from on board or explanations of data are linked. The entries of the feed can be assigned to specific points on the map by specifying coordinates. The feeds for the campaigns are generated automatically, based on specified URLs (blogs, social media).
Planned Features
- Mission planning
In the future, it should be possible to plan and create missions in the BELUGA Navigator for platforms that are fully integrated in BELUGA. - Annotation/logbook functions in the user interface
It shall be possible to document, mark or assign events in BELUGA Navigator based on information about time, position, campaign, platform and/or mission. This will also expand the automatic creation of mission reports. - Integration of further platforms
- Integration of further communication channels
- User management
In order to make functions or data (e.g. the control of certain platforms) only accessible to selected persons after the system has been expanded, a user administration with role distribution is to be introduced.
BELUGA Navigator
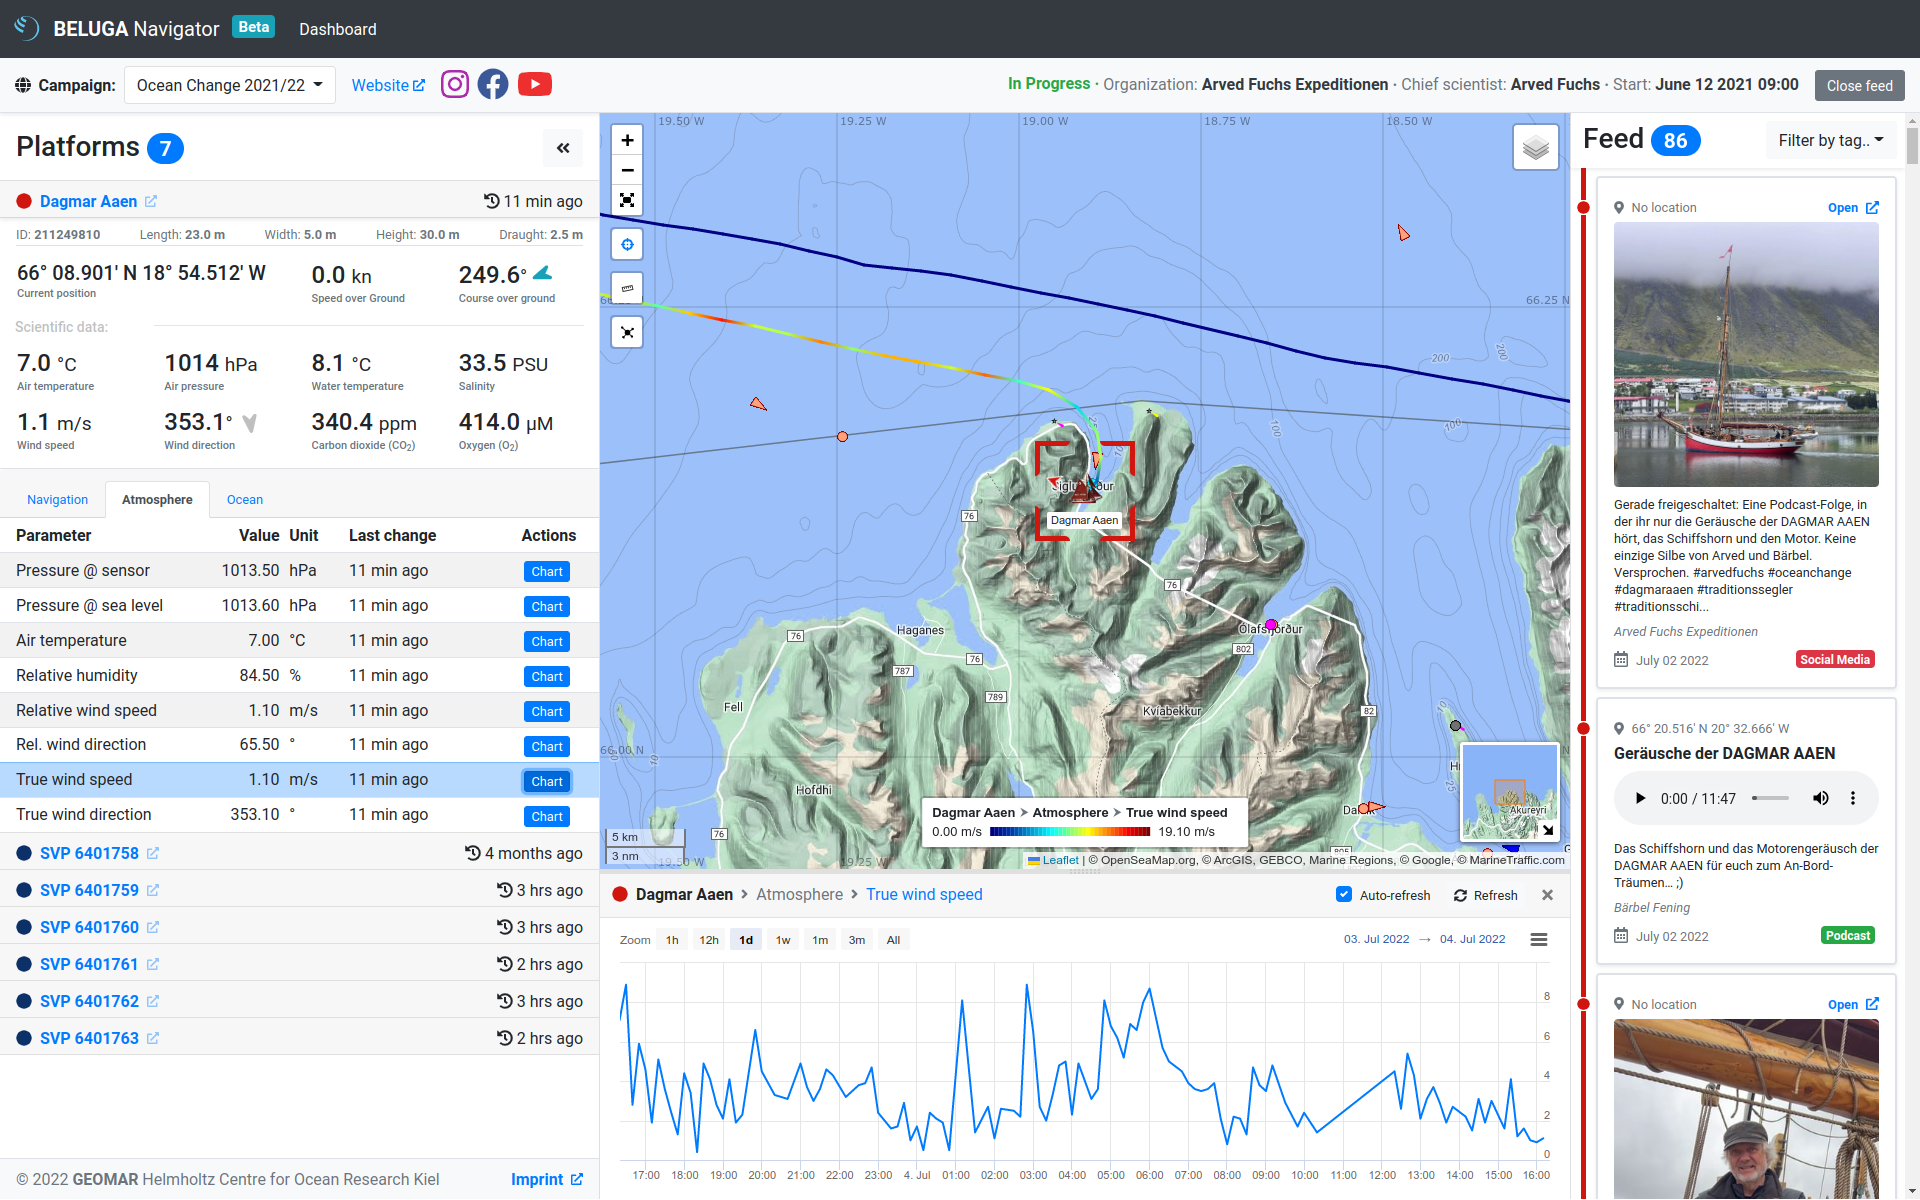
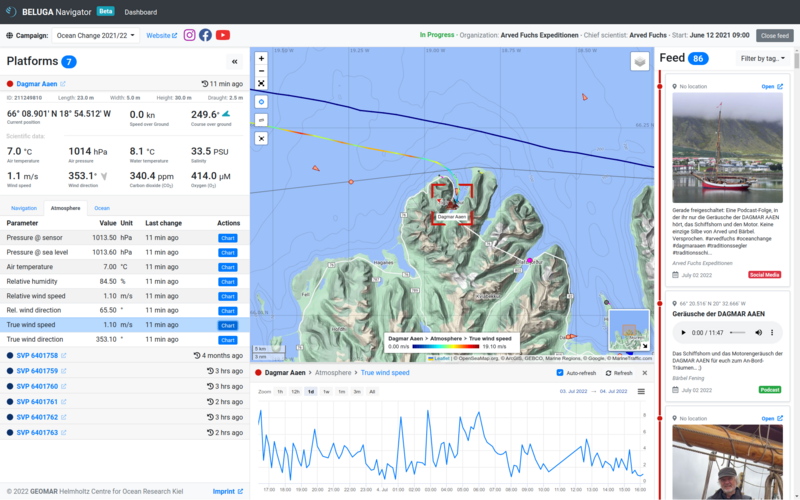
The user interface of BELUGA is the same both online and in the local system. It is built as a web application and can be opened from any browser. The website consists of several components, some of which appear and disappear as needed. In addition to a navigation bar at the top of the window, there is always a list of platforms on the left side, while the middle and right areas of the window are occupied by a map. Additional components appear at the right and bottom edges of the window. In the following, all components of the BELUGA Navigator are described. A first overview can be found in Figure 2.
- Navigation bar
At the top of the screen there is a bar with information and further links to the currently selected campaign. Another campaign can be selected in a drop-down menu. - Platform list
All platforms belonging to the campaign are displayed in a list on the left side of the screen. A platform can be selected by clicking on it, whereupon its list element expands and displays information about the platform. Since the information available varies depending on the type of platform, platform-specific list elements with customized layout are used. - Map
A large part of the interface is taken up by a map showing the positions of all platforms belonging to the campaign. Several overlays are available for the map, which can be used to display external data such as wind or bathymetries. These can be shown or hidden via a button in the upper right corner of the map. Buttons for zoom and measurement functions are available at the left edge of the map. - Media feed (optional)
If a feed has been created for the selected campaign, it can be seen on the right edge of the screen (see Figure 2). To enlarge the map area, the feed can easily be hidden by clicking a button in the navigation bar. In the feed, posts from various sources (for example blogs, podcasts, Youtube or social media) are displayed and linked with a flag in the map, if a position to the entry is available. - Chart viewer (optional)
The data of the platforms can be displayed graphically in a chart by clicking on the "Chart" button behind the respective parameter in the platform list. The window for the display then opens at the bottom of the screen (see Figure 2). In the window, the time period can be selected for which the value of the selected parameter is to be displayed. By clicking on "X" the window can be closed again, so that the map can take up more space. - Depth display (optional)
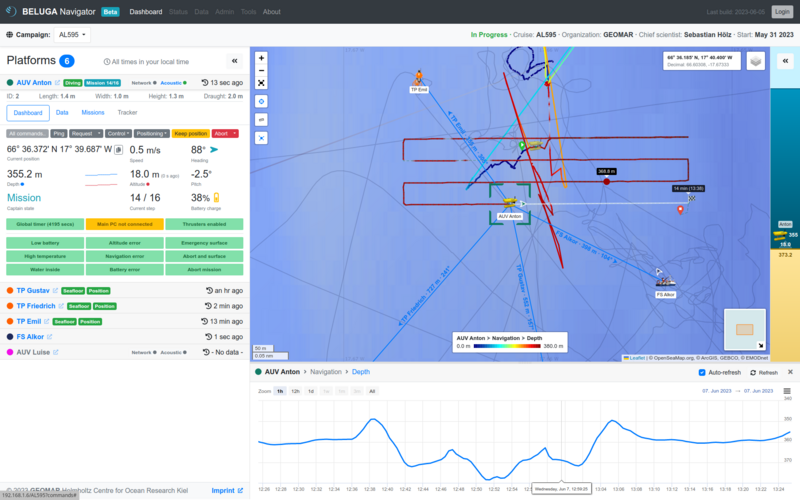
If there are platforms involved in the campaign that transmit their current depth and altitude, a display will appear on the right side of the screen (in the area where the feed appears, if applicable), showing the platforms in the water column (see Figure 3).

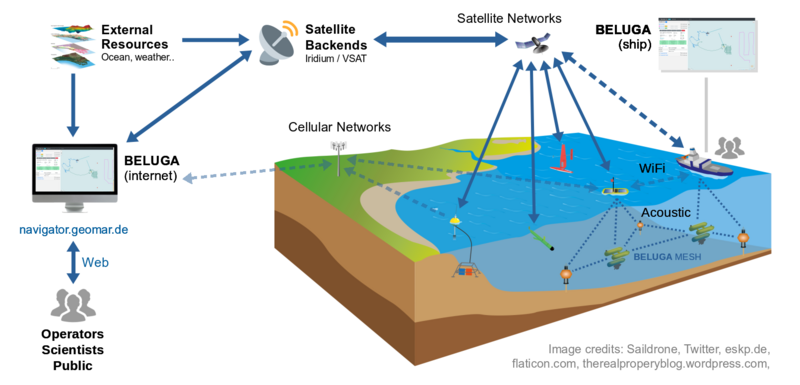
Interfaces and Communication
This section describes the integrated interfaces and devices used for communication in the local BELUGA network. In the local BELUGA system it is possible not only to display data, but also to send messages to the platforms. Platforms that send their data via satellite connections to a server, from where they can be displayed in the BELUGA system, are not considered here, since these communication paths differ depending on the type of platform, but all data converge in a database of the GEOMAR data management, from where BELUGA fetches them. Subsequently, the protocol for local communication is discussed.
Interfaces
To use a local BELUGA system, a shipboard console with the hardware for the system is used. Among other things, this contains two computers on which BELUGA itself and additional modules run. In addition to a router, a data storage device is also part of the system. BELUGA decides independently which of the available communication channels is used to send a message to a platform. Communication is currently possible via the following interfaces:
- Network
A local network is set up via the router of the shipboard console, through which platforms can communicate via WLAN. It is also possible to connect via Ethernet, for example to download data from platforms. - Acoustic modem (Evologics 18/34)
An acoustic USBL modem from Evologics can be used to communicate with platforms underwater.
Communication
Communication in the local BELUGA system is based on messages in DCCL format. The same messages are sent regardless of the interface used.
USBL Positioning
The Evologics USBL acoustic modem can be used to determine the position of a platform underwater. The USBL modem on the vessel sends a signal to the modem on the platform whose position is to be determined and the modem on the platform responds to the message. Based on the direction from which the response came and the time that has elapsed since the signal was sent, the position of the platform can then be calculated. This position determination by "pinging" a modem is possible for all platforms that have an Evologics modem for the appropriate frequency range.
The BELUGA system on board receives the information from the modem and then sends the calculated positions to the respective platform after a plausibility check, in which outlier positions are filtered out. The AUVs can forward the received position information to their internal navigation unit, which allows to support the AUV navigation, especially when no other navigation information is available.
LBL Ranging
This technique is also based on the acoustic modems and is supported by all Evologics modems. Similar to positioning via USBL, a signal is sent from the modem and the time to response is measured. Unlike the USBL modem used on the ship, simpler modems such as those used on AUVs are not USBL capable. Thus, they cannot determine from which direction an acoustic signal came. For this reason, based on the response signal, only a distance to the requested modem can be determined. To support AUV navigation by ranging, transponders are used. These are acoustic modems with buoyancy foam that are anchored with a weight at a fixed height above the seafloor, and float back to the surface after completing the mission by releasing the weight. The AUVs can determine their distance to the modems via LBL ranging and query the global position of the transponders at their modems. Using this information, AUV navigation can then be improved.
This page is in reconstruction - further details will be added soon.
If you have any questions regarding BELUGA, do not hesitate to contact us.