dsu-info(at)geomar.de
Timm Schoening
Leitung DSU
Anne Hennke
Visualization & Stories
Laura Haffert
AI & Digital Twins
Karl Heger
Imaging & Robotics
Judith Fischer
AI, Imaging & Robotics
Sophie Schindler
Image Data Steward
As part of the Data Science Unit's portfolio, we create storymaps - a visually appealing presentation format. They are intended to be able to give other researchers, as well as non-scientific interested parties, a quick initial overview of a particular topic. For those who wish to look deeper into the topic, a wide selection of links will be provided. Potential topics for our storymaps are special data sets and data types, highlighting their potentials, as well as the presentation of current data science projects at GEOMAR.
This storymap provides an overview of the data set collected at the Boknis Eck time series measurement station and the associated scientific questions. An integrated data dashboard allows interactive exploration of a large part of the data set.
This interactive application enables the user to follow the dynamic development of the measured parameters at the time series station over more than 30 years. An interactive scatter plot provides information about possible correlations between parameters and how they react at different depths. Please note that not the entire time series station data set is integrated and that the tools are intended for initial data exploration only. They do not replace the creation of specific diagrams for scientific evaluation. Feel free to contact us for questions and more information about this product.
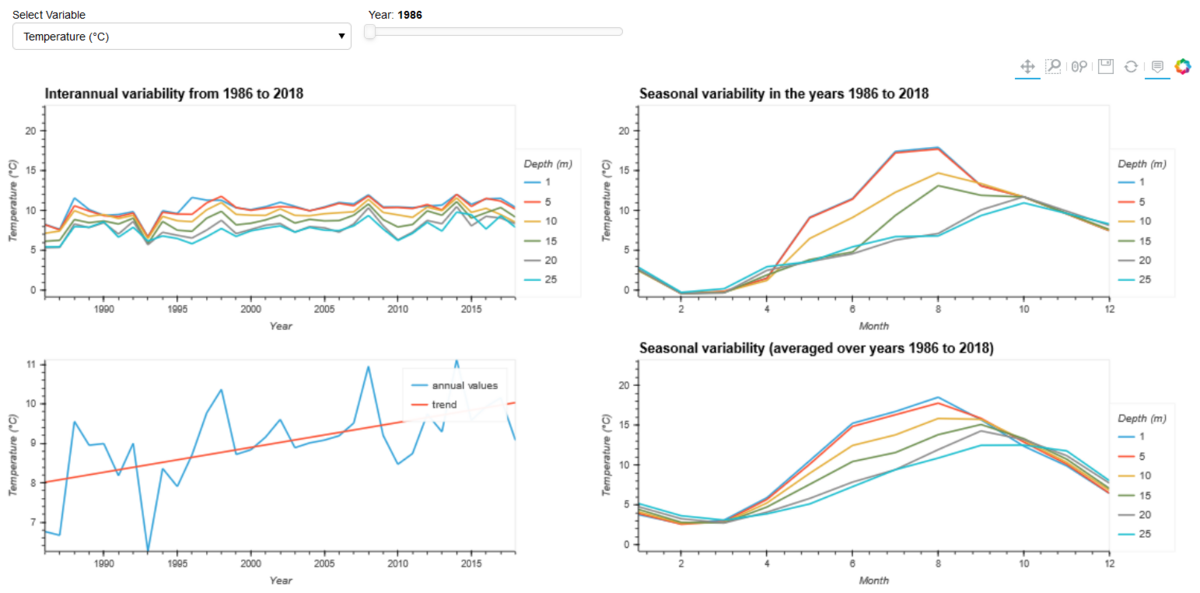
Explore the trend of selected parameters over more than 30 years.
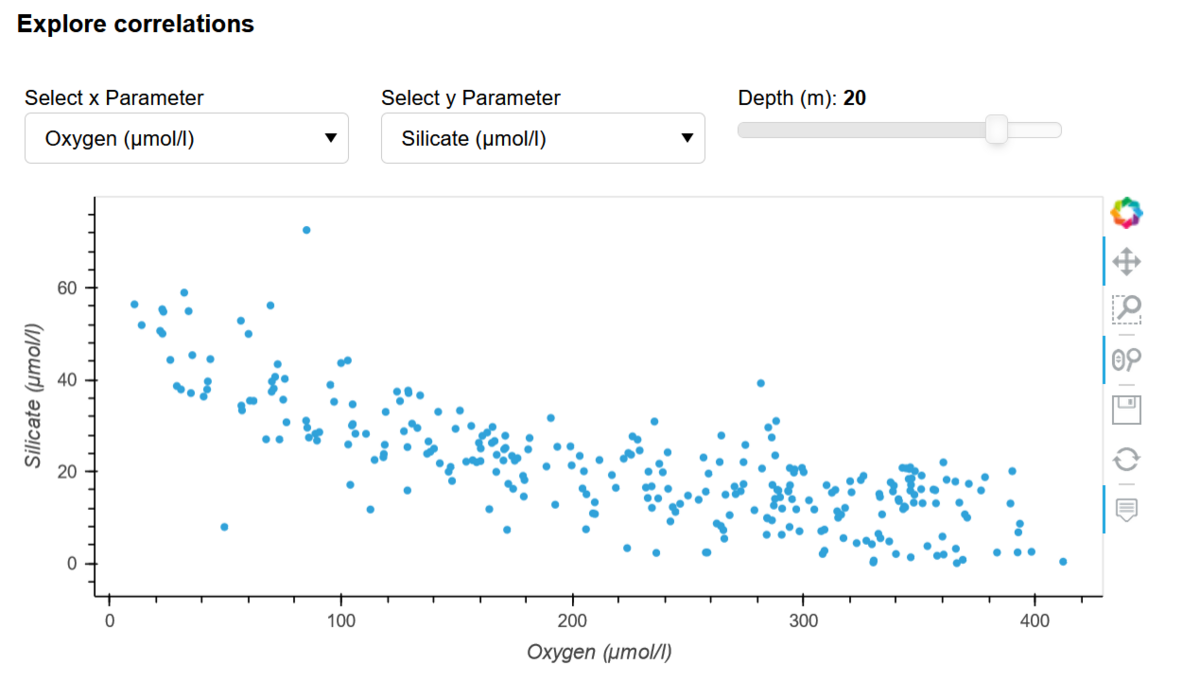
Explore correlations in different depths.