Overview
TIMS delivers high precision isotope ratio determinations of many elements throughout the periodic table. We currently operate two TIMS; a MAT262 RPQ2++ (1997; TI-Box conversion 2023) and a TRITON Plus (2014). We also provide working time for technical service and maintenance of a TRITON Classic (2001) allocated in RD2. We focus on high precision radiogenic Sr, Nd, Pb isotope ratios as tracers in magmatic geochemistry. Uranium Series (U-Th-Ra disequilibria) in silicate rocks are presently in standby. Fundamental method developments in stable Boron and stable Calcium isotope ratio measurements were carried out in the early years of the lab.
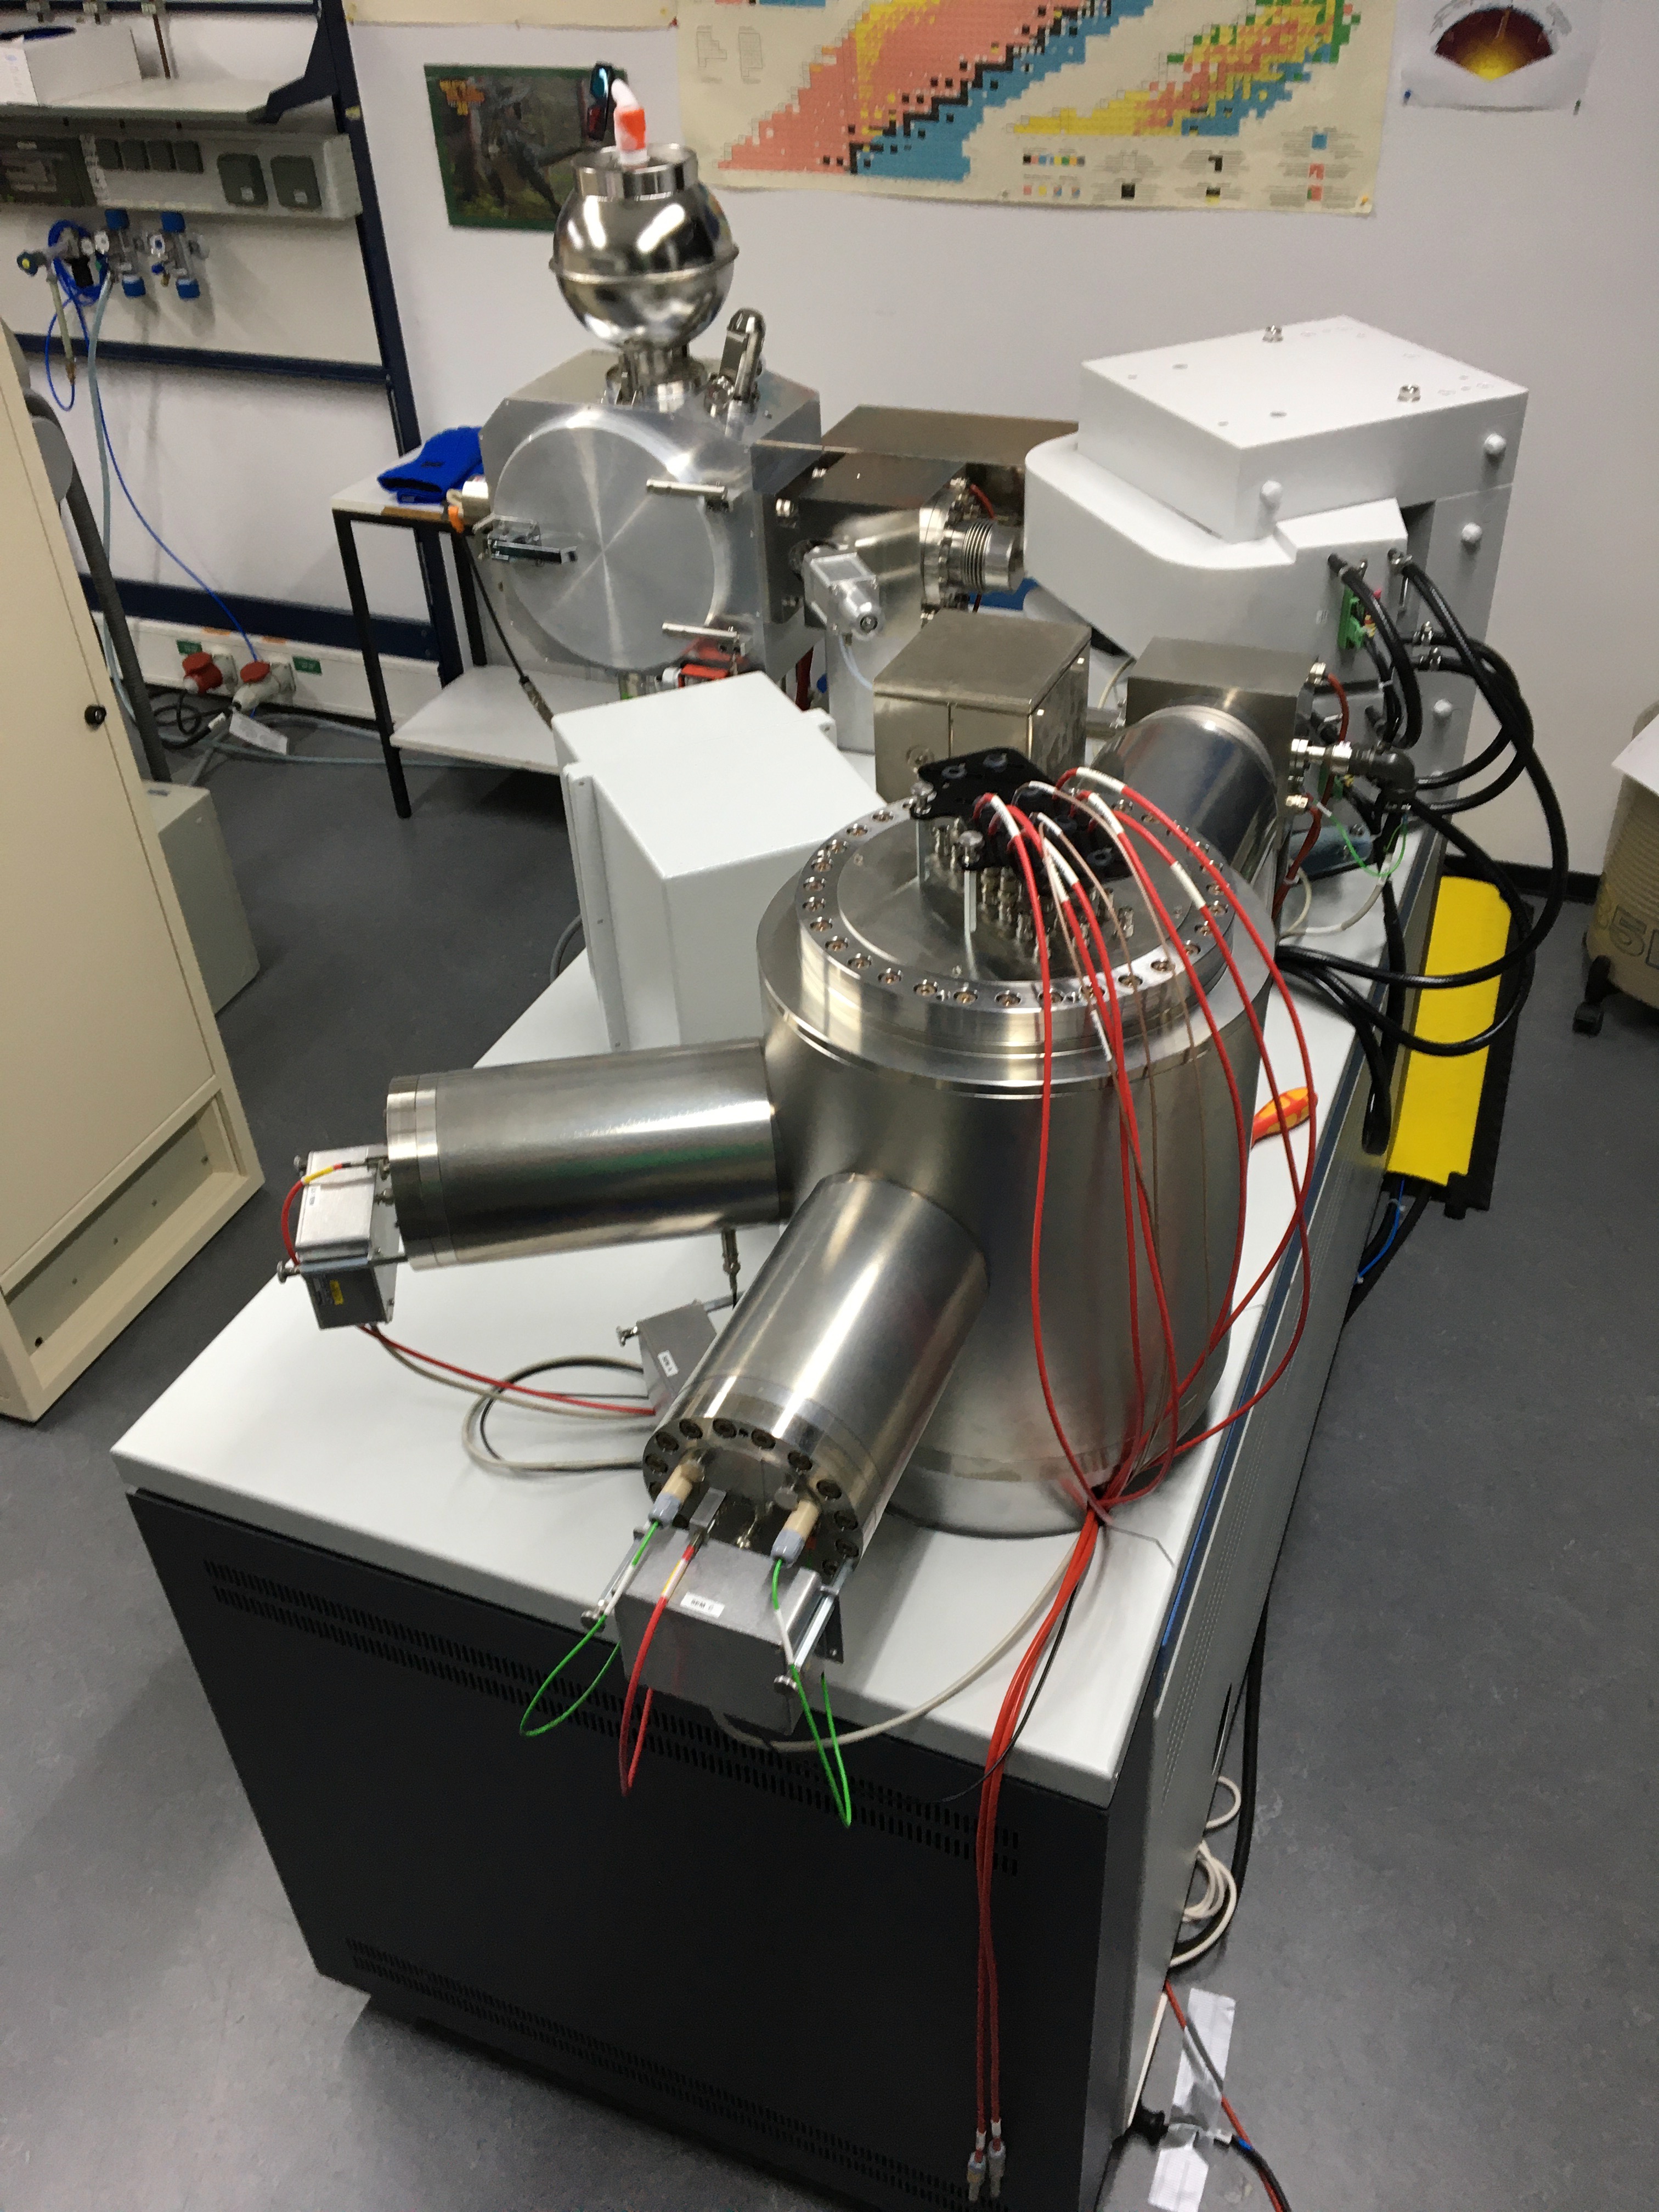
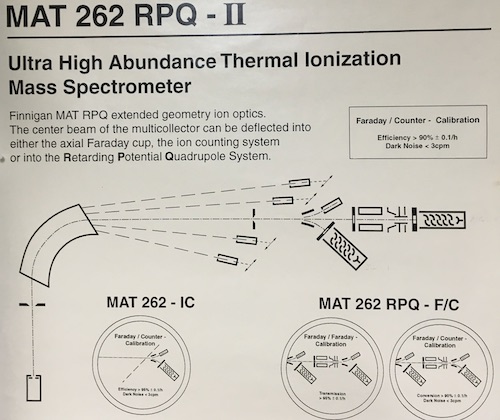
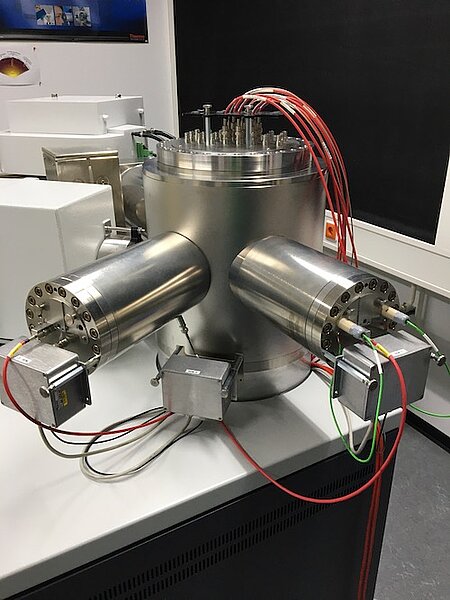
MAT262 - TI-Box
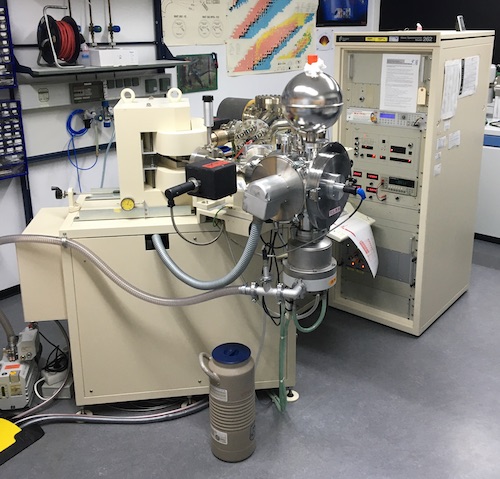
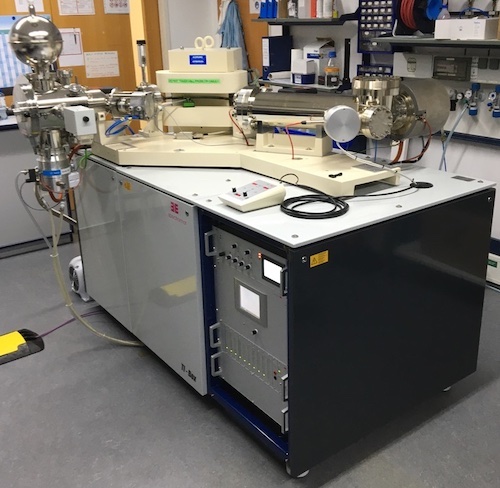
Components
9x faraday collectors with Pb and CsB double cups on high and low mass side respectively, 2x ion counters, 1x RPQ energy filter. @ TI-Box conversion 1x ion counter and RPQ removed.
History
1996: installation
2002: exchange of all faraday collectors
2005: switch to Spectromat MS control software
2006: replacement high voltage supply (positive ion mode)
2015: replacement of MS control computer
2017: replacement ion getter pump high voltage supply
2023: conversion to Spectromat TI-Box = complete replacement of electronics, 10^11Ω amplifiers, sample wheel drive, manual filament control, vacuum gauges, turbo pump, fore vacuum pump, water chiller, software, MS controlling computer along with upgrade of two ion sources.
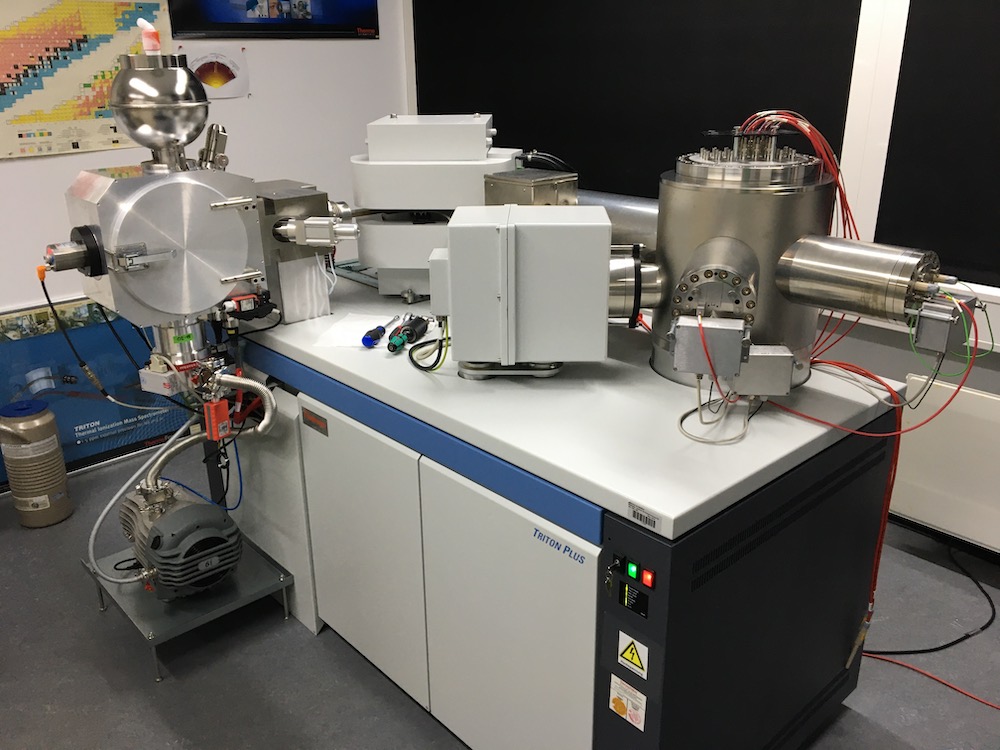
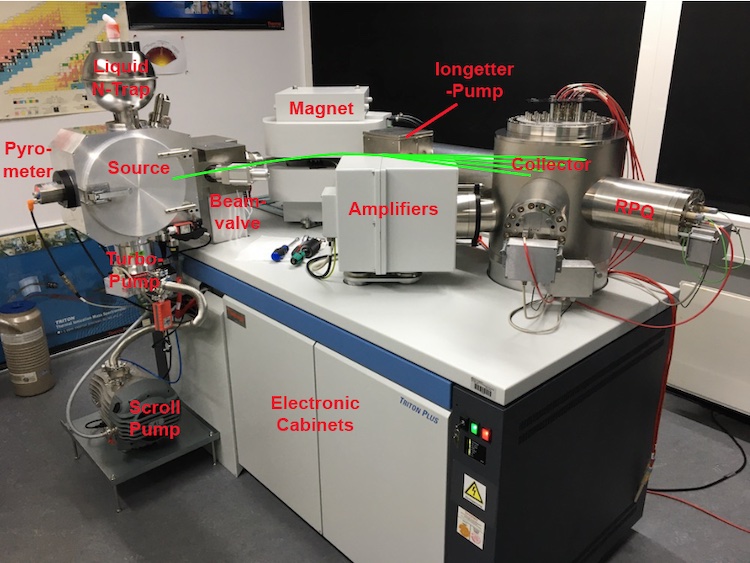
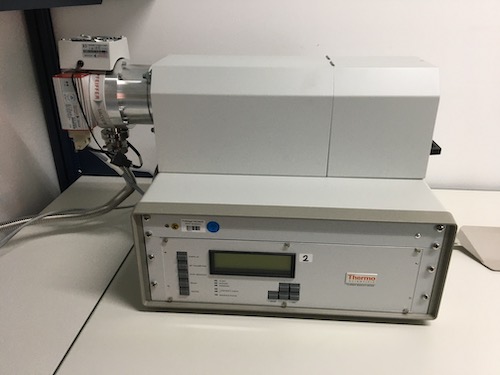
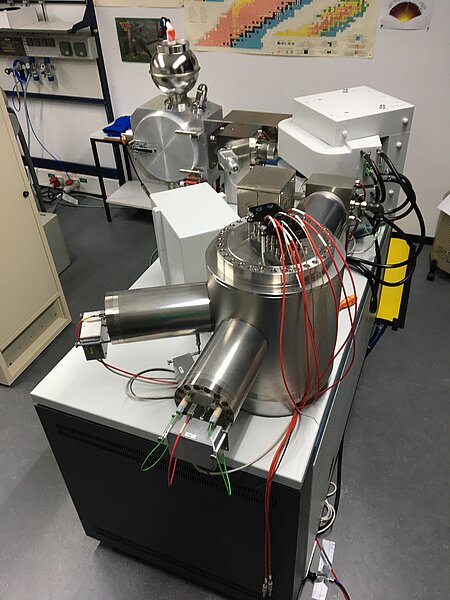
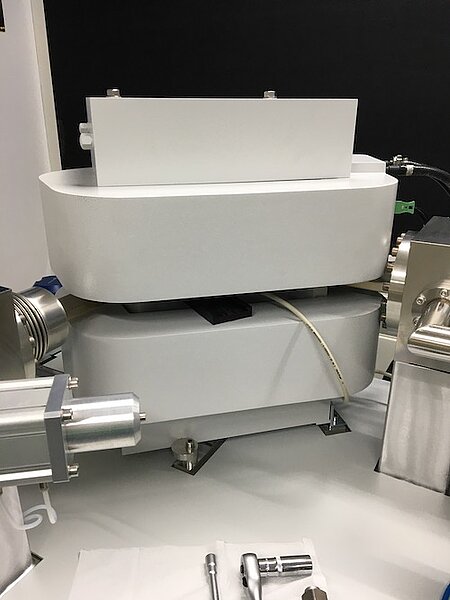
TRITON Plus
Components
10x faraday collectors, Pb multi-ion counting, 1x RPQ energy filter, 2x ion counters.
Optional, solitary 10^12 Ω and 10^10 Ω amplifiers.
History
2014: installation
2016: exchange of faraday cup shells H1 & H3
2018: exchange of faraday cup shell H3
2019: exchange high voltage supply
2020: switch from static to multi-dynamic Sr & Nd measurements
2020: upgrade MS control unit to WIN10
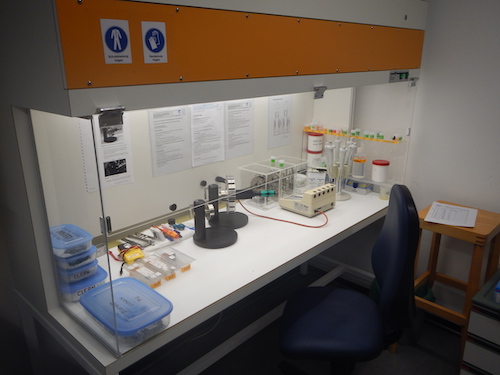
Peripherals
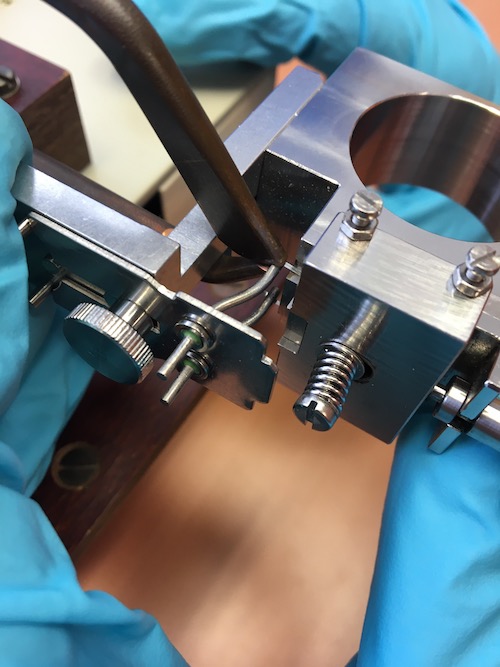
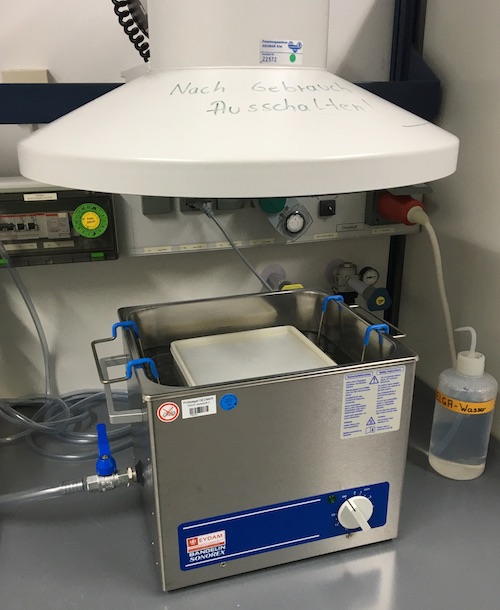
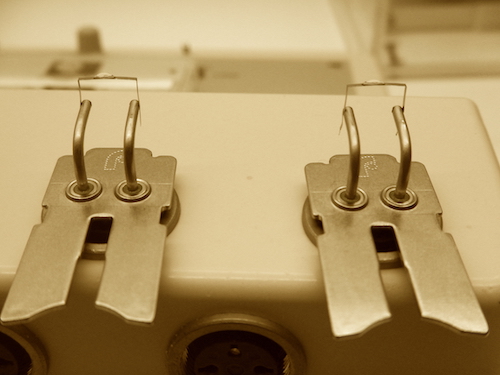
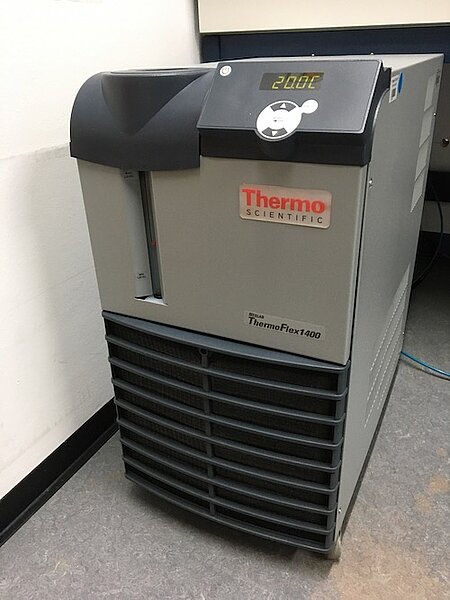
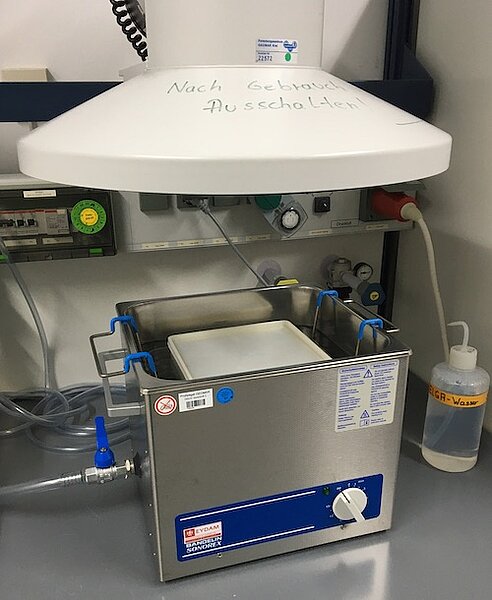
A number of additional instruments are directly related to TIMS analysis. These include but are not limited to making single and double filaments by spot welding ultra-pure metal wire (e.g. Rhenium) onto filament holders followed by filament outgassing under high vacuum. Samples are loaded onto filaments in an ISO 14644-1 Class 4 workstation. Compressed air is required to operate the beam-valve that separates the ion source from the analyzer. Similarily a water chiller supplies 20°C water to “cool” the magnet and turbo pump. Oil free scroll pumps generate a fore vacuum of ~2x 10^-2 hPa to operate the turbo pumps. A drying cabinet is used for drying liquid nitrogen traps after use and filaments and shield plates after cleaning them in an ultrasonic bath.

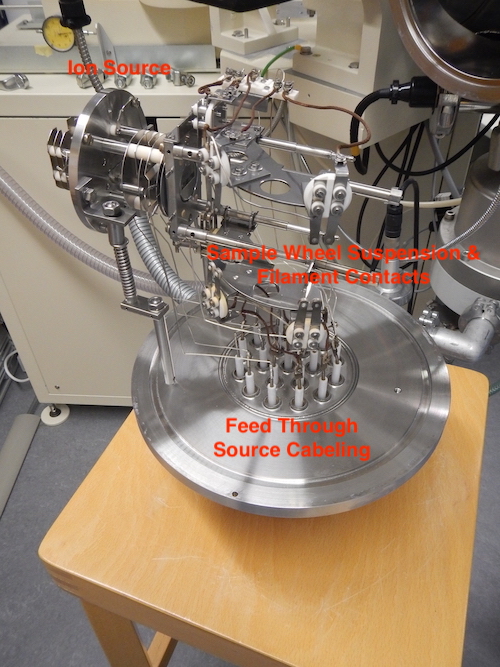
Functional Principle of TIMS
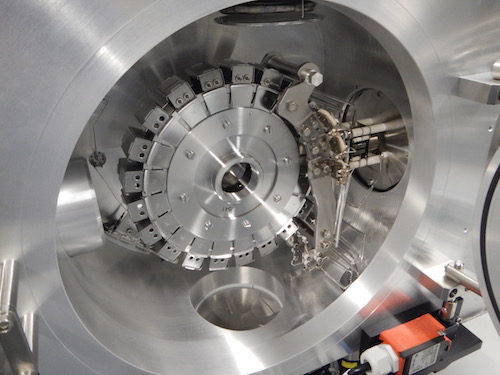
Prior to TIMS analysis the element of interest has to be separated and purified from the sample matrix by chromatographic methods in a clean room chemistry lab. Samples are then loaded onto rhenium filaments that are mounted on a sample wheel which is then inserted into the source housing of the TIMS. The latter is evacuated to 1x10^-7 to 10^-8 hPa over 6 to 12 hours before a filament can be heated up by applying electrical current. Depending on the ionization potential of elements, variable currents respectively temperatures are needed for ionization. Ions of e.g. Pb+, Sr+ and Nd+ typically require temperatures of 1180-1240°C, 1350-1450°C and 1600-1800°C, respectively. They are accelerated by a 10kV ionization potential in the ion source. The ion source not only accelerates ions to a common "speed" but also focuses the ion cloud by a series of lenses into an ion beam that is introduced into the high vacuum analyzer (~3x 10^-9 hPa) of the MS. Here, the ion beam enters a stable magnetic field that separates ions by mass as a function of mass and charge. In other words, after the ions have passed the magnet the ion beam is split up into a fan of mass specific ion beams. For example, an ion beam of Sr is separated into masses 84, 86, 87 and 88; the four naturally occurring Sr isotopes. The mass specific ion beams are then "collected" by faraday cups. They house graphite shells where the ions are electrically neutralized, causing a very small flow of electrons in the range of 0.001 up to 50x 10^-11 A. The latter is then wired to high resistance amplifiers (usually 10^11 Ω) and the resulting voltage (V = Ω x A) processed by the software. The ion beam intensities are thus a reflection of isotope abundance of an element. Since the ion beam intensities of the various isotopes are measured simultaneously in the faraday multi-collector, a measured isotope ratio of -for example- mass 87/86 is "simply" the division of voltages measured for mass 87 and 86. Although this may sound trivial the ion currents are measured at very high precision so that differences in isotope abundance can be measured to ≤0.0008% 2SE precision for 87Sr/86Sr and 143Nd/144Nd and to ≤0.005% 2SE precision for Pb isotope ratios.


Mass Bias Correction
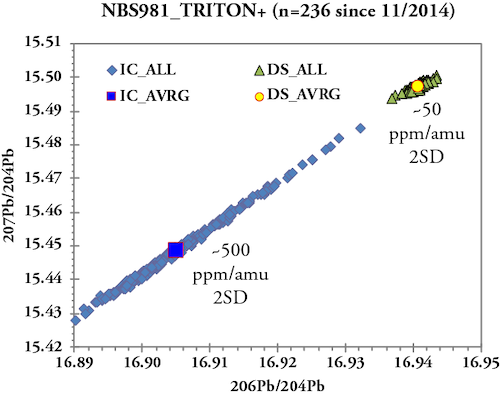
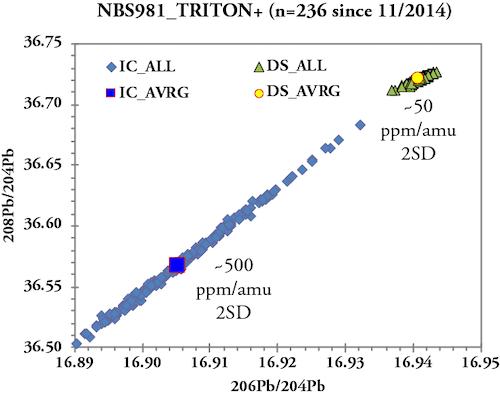
Ionization of an element causes fractionation of its isotopes leading to depletion of lighter isotopes relative to heavier isotopes. In case of a TIMS ion source the same sample load is usually ionized over a period of 1-2 hours causing ever increasing mass-bias with time. In isotope systems with at least two stable isotopes the mass bias (%/amu) is corrected by normalization of the measured isotope ratios to an internationally agreed stable isotope ratio such as 86Sr/88Sr = 0.1194 or 146Nd/144Nd = 0.7219. In contrast 204Pb is the only stable Pb isotope and thus within run mass bias correction using naturally occurring Pb isotopes is not possible. For many years Pb mass bias correction in our lab successfully applied an external correction based on repeated measurements of a Pb standard (e.g. NBS981) and correction to reference values (e.g., Todt et al 1996). The mass bias correction values obtained for the Pb standard were then applied to the measured Pb isotope ratios of samples. This type of mass bias correction, however, limits 2SD of Pb isotope ratio analysis to about 0.03%/amu or 300ppm/amu based on ~800, unfiltered NBS981 measurements from 1997 to 2007 on the MAT262 using 100 ng loads of Pb and an emitter with high silica content. To overcome these analytical limitations and to resolve small-scale Pb isotopic variations in sample sets, we established a Pb double spike (DS) technique in 2007 (Hoernle et al. 2011, EPSL). Pb-DS basically involves a second, independent measurement of the sample Pb admixed with a 204Pb-207Pb spike. The latter contains artificially enriched 204Pb and 207Pb and its composition is calibrated against a fixed 208Pb/206Pb ratio of 1.00016 for NBS982. The mass bias correction is then obtained by deconvolution of the two Pb measurements (IC + DS) and the spike composition. Pb-DS allows for stringent mass bias correction of individual samples and thus overcomes matrix effects that influence the fractionation behavior of individual samples. The use of Pb-DS has improved the external reproducibility (2SD) of NBS981 to ≤ 0.005%/amu (50 ppm/amu) on the MAT262 and TRITON Plus which represents at least a six-fold enhancement of analytical precision compared to external mass bias correction. Pb specialists will have noticed that 2SD for the NBS981 IC measurements increased to 500 ppm/amu compared to the 1997-2007 measurements. This reflects ~10 times smaller Pb loads (8-16 ng vs 100 ng) in conjunction with a high efficiency silica gel emitter (Gerstenberger & Haase 1997). Still the joint DS measurement is capable to intercept the larger mass bias variations of the IC determinations and provide correction to fairly uniform Pb ratios.
Quality Control: Single Element Standards
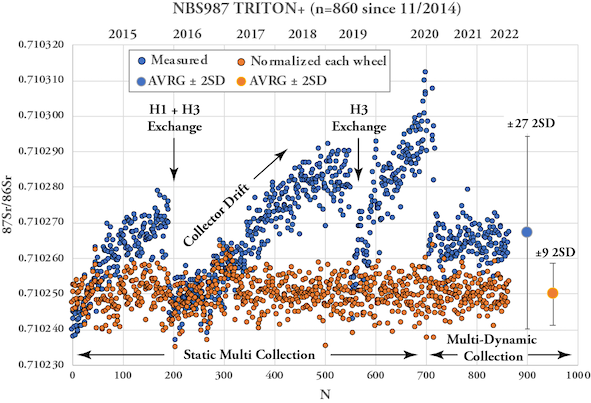
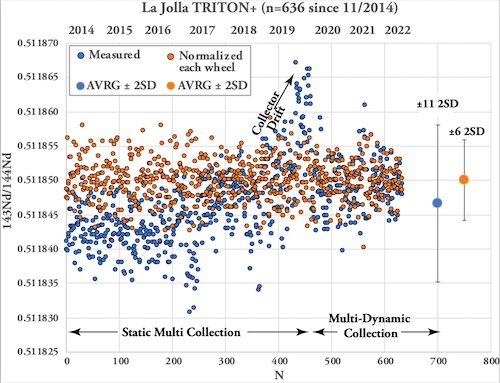
The analytical quality of TIMS mesurements is monitored by repeated measurements of single element reference materials NBS987 (Sr), La Jolla and SPEX CertiPrep© (Nd) and NBS981 (Pb) along with the samples on each wheel. Ions accumulating over time can lead to alteration of the faraday cups and cause long-term drifts of Sr and Nd isotope ratios. Therefore our lab routinely normalizes the averages of standard measurements (n=4 to 5) obtained for each wheel to the accepted / preferred standard values and applies the offset value to the measured sample data. For instance, all measured NBS987 on the TRITON Plus averages 87Sr/86Sr = 0.710268 ± 0.000027 (2SD, n=860, since 2014) while the "wheel normalized" NBS987 gives 87Sr/86Sr = 0.710250 ± 0.000009 for the same set of measurements. Similarly, all measured La Jolla Nd on the TRITON Plus averages 143Nd/144Nd = 0.511847 ± 0.000011 (2SD, n=638, since 2014) and the wheel normalized La Jolla data set gives 143Nd/144Nd = 0.511850 ± 0.000006. The normalization per wheel ensures unhampered comparability of sample data generated over longer periods and ensures best possible analytical output. Despite multiple replacements of H1 and H3 faraday cup shells of the TRITON Plus, 87Sr/86Sr of NBS987 repeatedly underwent systematic long-term drifts in static collection mode. This is presumably related to alteration of H3 reflecting the 82.58% natural abundance of 88Sr measured in this cup. Similar observations but less distinct were made for 143Nd/144Nd. To overcome the long-term drift problem, in 2020 Sr & Nd measurements were switched from static -where each isotope is measured in a dedicated faraday cup- to multidynamic collection where critical isotopes (86, 87, 88Sr and 143, 144, 146Nd) are measured twice in different cups by rotation of the magnetic field. This measure leads to equalization of differences in cup efficiency but requires stable ion beams and increases analytical time per position by 50%. Long-term Pb-DS corrected NBS981 values on the TRITON Plus are 208Pb/204Pb = 36.7206 ± 0.0050, 207Pb/204Pb = 15.4975 ± 0.0019, 206Pb/204Pb = 16.9408 ± 0.0019, 208Pb/206Pb = 2.167585 ± 0.000097 and 207Pb/206Pb = 0.914801 ± 0.000048 (2SD, n=236 since 2014). These values compare very well with published double and triple spike Pb data of NBS981 and our lab is listed in Taylor et al. 2014.
Quality Control: Silicate Standards
To further assess accuracy of TIMS measurements and validity of chemical procedures, silicate reference materials (RMs) or standards are being processed along with each sample series. After careful evaluation of literature data and own experience, we note that Pb cannot be reproduced on unleached RMs of AGV-2, BCR-2, BIR-1 and BHVO-2 at a similar 2SD level as obtained by Pb-DS for NBS981 or replicate analysis of regular samples. Our experiments concur that 2M HCl leaching of BCR-2 (~10 µg/g Pb) and AGV-2 (~11 µg/g Pb) at 70°C for one hour followed by triple rinsing of the residues in 18MΩ water prior to HF-HNO3 dissolution successfully removes the Pb contaminant that has been introduced during the original manufacturing of these RMs. For RMs with lower Pb concentrations such as BHVO-2 (~1.6 µg/g) or BIR-1 (~3 µg/g), the Pb contaminant is not fully removed by acid leaching and therefore, these RMs are not used by us to validate accuracy of high precision Pb-DS analysis. Results of radiogenic Sr-Nd-Pb-Hf isotope ratio determinations for leached BCR-2 generated by us agrees well with literature data. See table below.
Table: Radiogenic Sr-Nd-Pb-Hf isotope ratios of 2M HCl leached BCR-2 reference material at GEOMAR (>50 dissolutions) in comparison to literature data.
| RM | BCR-2 | BCR-2 | BCR-2 | BCR-2 |
| Source | GEOMAR | |||
| leaching | Sr-Nd-Pb-Hf | Pb | Pb | unspecified |
| N | >50 | 7, 10, 3, 11 | 4 | pref. values |
| 87Sr/86Sr | 0.705003 | 0.705006 | - | 0.704920 |
| 2SD (abs) | 0.000012 | 0.000007 | - | 0.000550 |
| 143Nd/144Nd | 0.512634 | 0.512643 | - | 0.512635 |
| 2SD (abs) | 0.000010 | 0.000014 | - | 0.000029 |
| 206Pb/204Pb | 18.8023 | 18.7988 | 18.8004 | 18.7540 |
| 2SD (abs) | 0.0019 | 0.0027 | 0.0038 | 0.0180 |
| 207Pb/204Pb | 15.6236 | 15.6235 | 15.6238 | 15.6220 |
| 2SD (abs) | 0.0019 | 0.0028 | 0.0016 | 0.0100 |
| 208Pb/204Pb | 38.8239 | 38.8281 | 38.8287 | 38.7260 |
| 2SD (abs) | 0.0061 | 0.0099 | 0.0049 | 0.0440 |
| 207Pb/206Pb | 0.83094 | 0.83109 | 0.83104 | - |
| 2SD (abs) | 0.00006 | 0.00006 | 0.00020 | - |
| 208Pb/206Pb | 2.06484 | 2.06545 | 2.06532 | - |
| 2SD (abs) | 0.00019 | 0.00032 | 0.00030 | - |
| 176Hf/177Hf | 0.282870 | 0.282869 | - | 0.282865 |
| 2SD (abs) | 0.000005 | 0.000014 | - | 0.000013 |
References
Fourny et al (2016) Comprehensive Pb-Sr-Nd-Hf isotopic, trace element, and mineralogical characterization of mafic to ultramafic rock reference materials. Geochemistry, Geophysics, Geosystems 17(3):739-773. doi:10.1002/2015GC006181
Gerstenberger H, Haase G (1997) A highly effective emitter substance for mass spectrometric Pb isotope ratio determinations. Chem Geol 136(3):309-312. doi:10.1016/S0009-2541(96)00033-2
Hoernle et al (2011) On- and off-axis chemical heterogeneities along the South Atlantic Mid-Ocean-Ridge (5-11°S): Shallow or deep recycling of ocean crust and/or intraplate volcanism? Earth and Planetary Science Letters 306(1-2):86-97. doi:10.1016/j.epsl.2011.03.032
Jochum et al (2016) Reference Values Following ISO Guidelines for Frequently Requested Rock Reference Materials. Geostandards and Geoanalytical Research 40(3):333-350. doi:10.1111/j.1751-908X.2015.00392.x
Taylor RN, Ishizuka O, Michalik A, Milton JA, Croudace IW (2015) Evaluating the precision of Pb isotope measurement by mass spectrometry. Journal of Analytical Atomic Spectrometry 30(1):198-213. doi:10.1039/C4JA00279B
Todd et al (2015) Effects of simple acid leaching of crushed and powdered geological materials on high-precision Pb isotope analyses. Geochemistry, Geophysics, Geosystems 16(7):2276-2302. doi:10.1002/2015GC005804
Todt W, Cliff RA, Hanser A, Hofmann AW (1996) Evaluation of a 202Pb–205Pb Double Spike for High - Precision Lead Isotope Analysis. In: Earth Processes: Reading the Isotopic Code. pp 429-437. Geophysical Monograph Series Vol 95, eds. Basu A and Hart S. doi:10.1029/GM095p0429